
During a weather-emergency surge, a municipal ops desk opens one view that shows API Gateway 5xx rates, Lambda duration, and DynamoDB throttle counts together. What should they use to review that application health in one place?
Select an answer to reveal the explanation.
Short Explanation
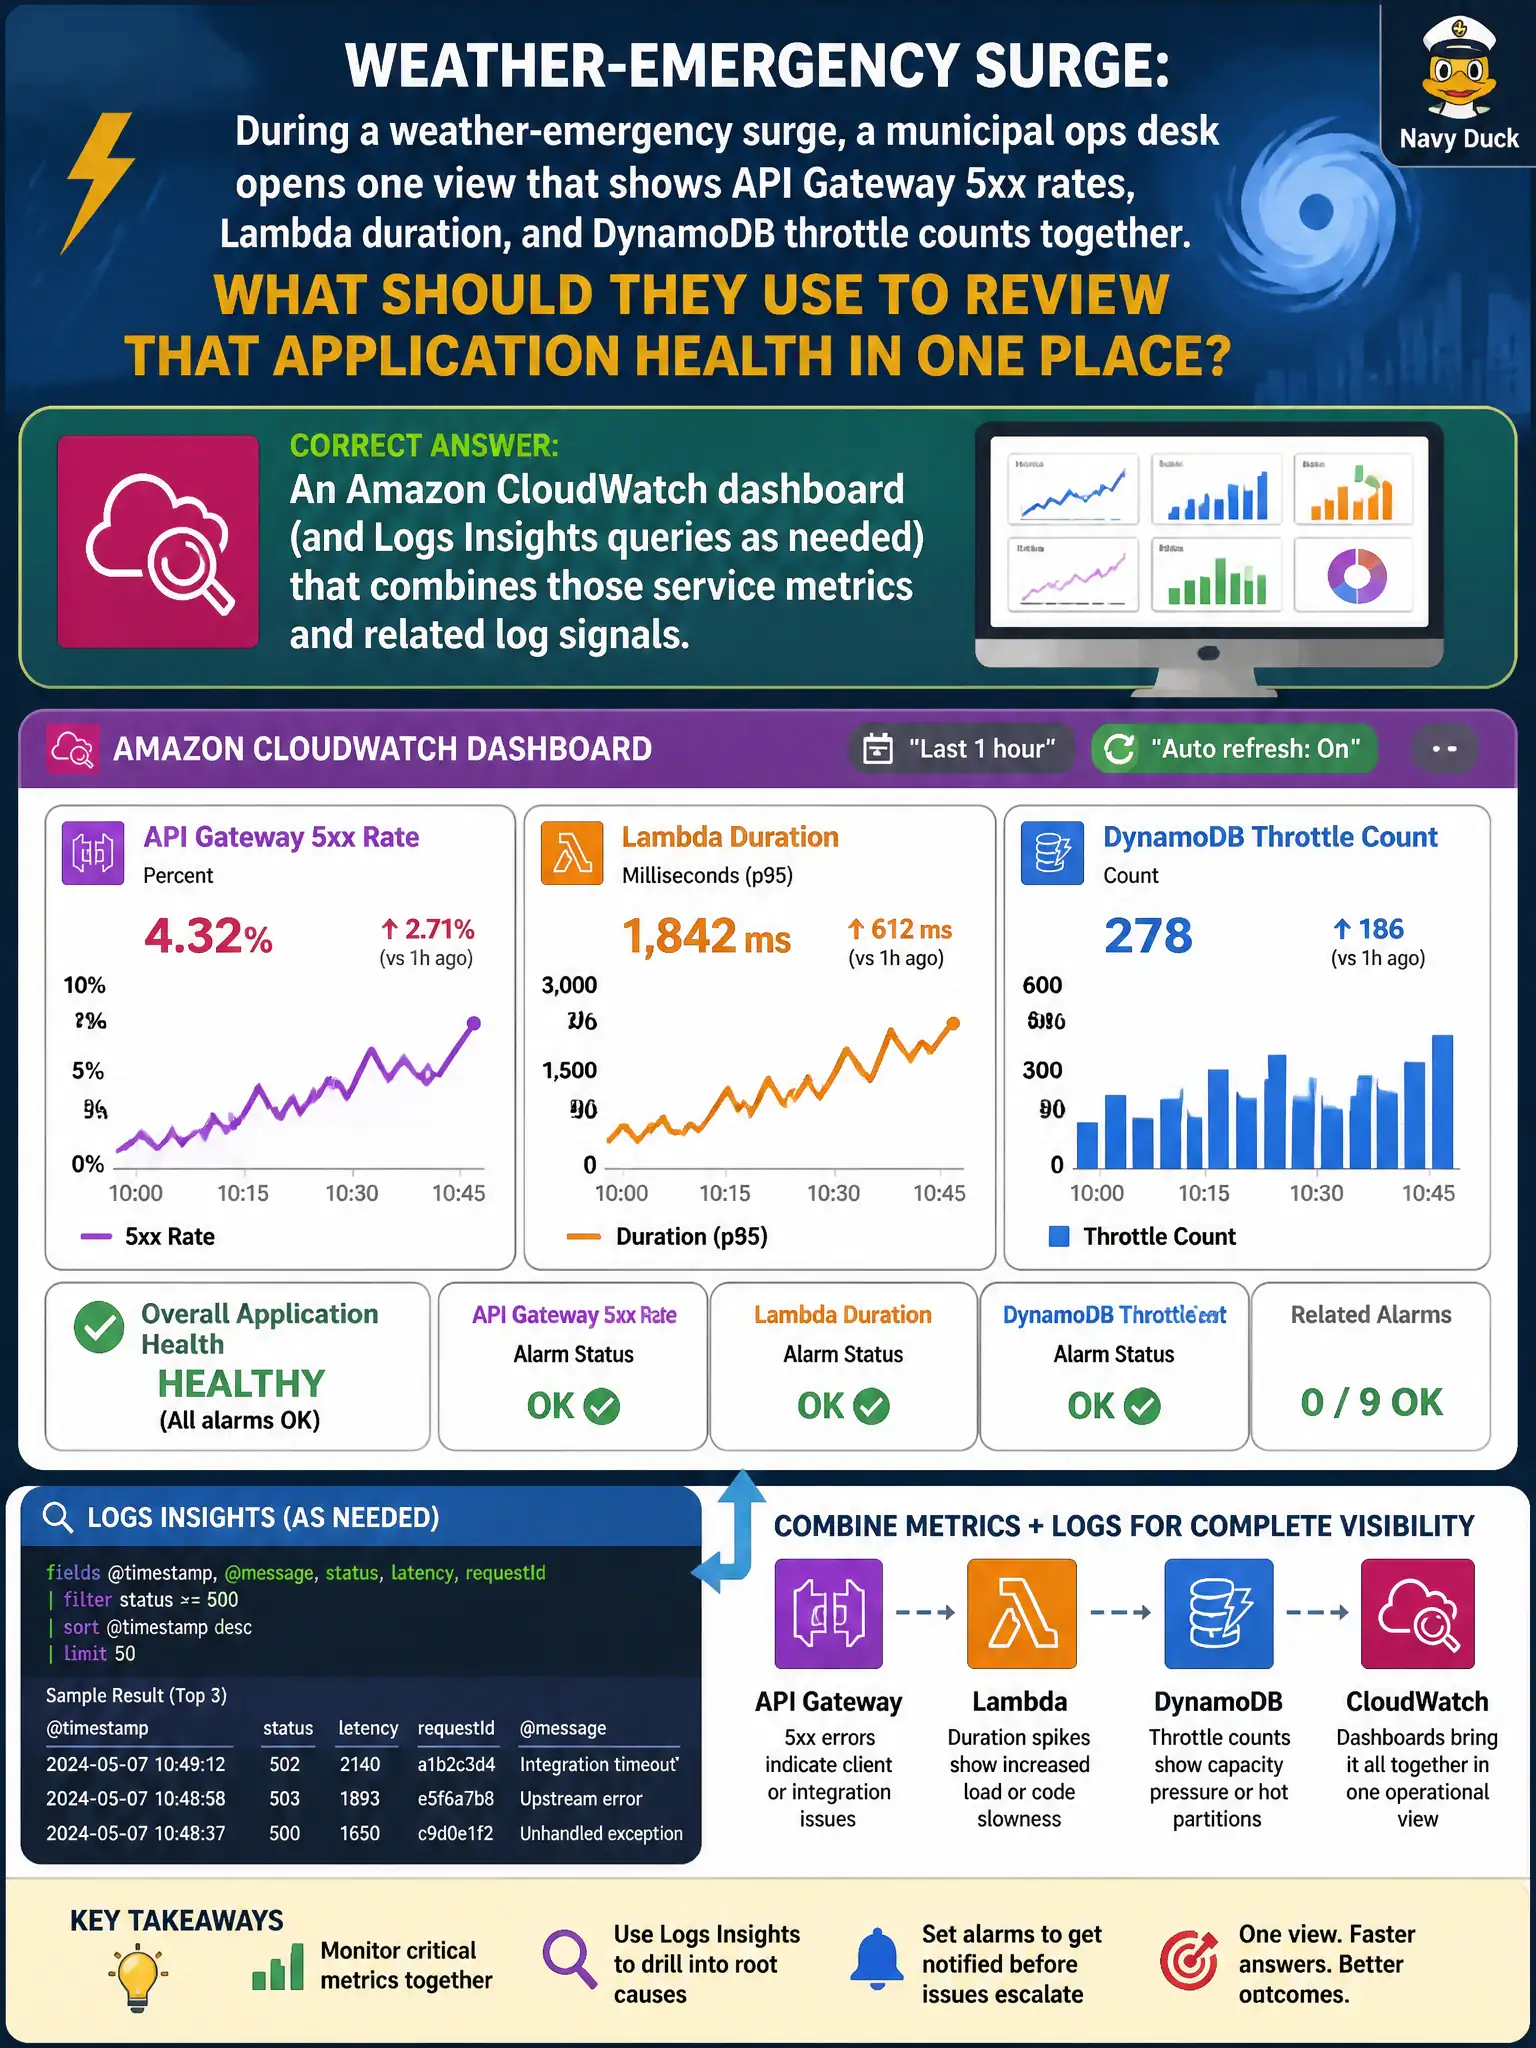
When the storm hits the help desk, you want one glass cockpit—not three browser tabs and a prayer. CloudWatch dashboards (plus Insights when you need to dig) pull API 5xx, Lambda duration, and DynamoDB throttles into one health view.
Full Explanation
During a weather-emergency surge, a municipal ops desk needs one view of API Gateway 5xx rates, Lambda duration, and DynamoDB throttle counts together. An Amazon CloudWatch dashboard—supplemented with Logs Insights queries as needed—combines those service metrics and related log signals in a single operational surface. That is how on-call staff triage citizen-facing degradation without hopping blindly across unrelated consoles while storm call volume rises.
A single S3 bucket inventory report is an object inventory signal, not runtime health for API Gateway, Lambda, or DynamoDB. AWS Cost Explorer daily spend charts show cost, not request failures or throttles during the surge. Amazon QuickSight for council budget slides serves analytics storytelling, not real-time operational telemetry for emergency response desks.
Exam caveat: CloudWatch dashboards aggregate metrics and alarms; Logs Insights answers deep log questions—together they cover the ops desk's surge needs without substituting billing tools for application health.
Operational check: pre-build a surge dashboard with the three metric widgets, validate it during a load test, bookmark it for the ops desk, and practice a Logs Insights drill correlating 5xx spikes to error strings before the next weather event.