
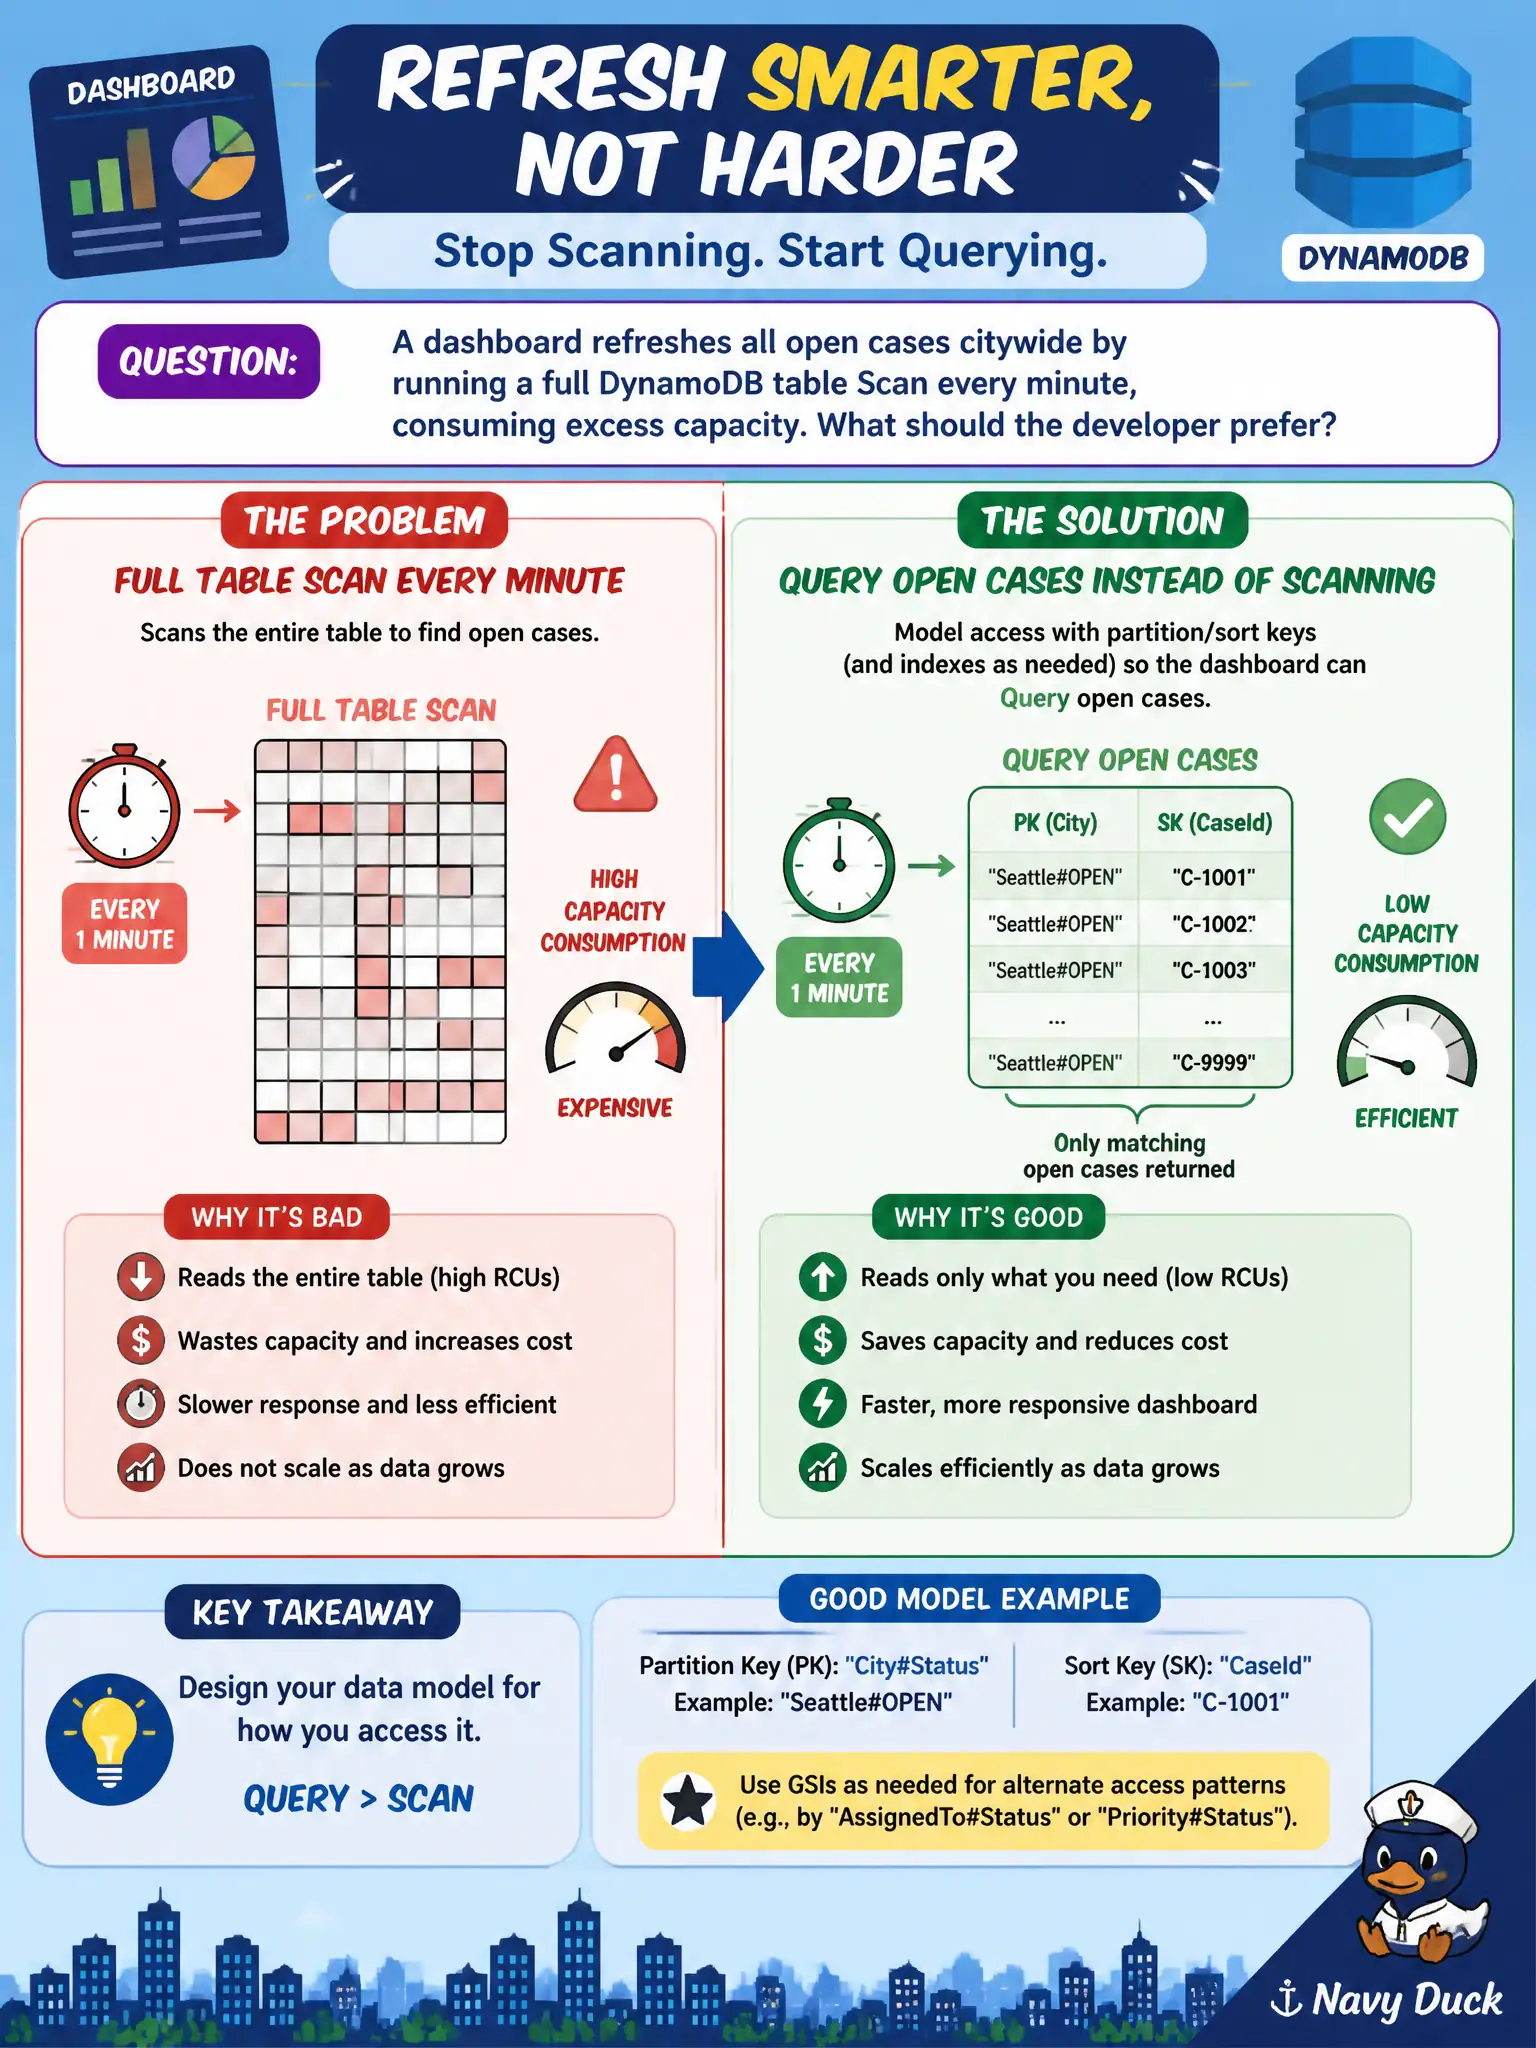
A dashboard refreshes all open cases citywide by running a full DynamoDB table Scan every minute, consuming excess capacity. What should the developer prefer?
Select an answer to reveal the explanation.
Short Explanation
A Scan every minute is reading the whole warehouse to find open boxes—Query with the right keys is walking straight to the open-cases shelf. Burning capacity on endless Scans is the expensive habit to break.
Full Explanation
A dashboard that refreshes all open cases citywide by running a full DynamoDB table Scan every minute consumes excess capacity—model access with partition/sort keys (and indexes as needed) so the dashboard can Query open cases instead of scanning the whole table. A sparse GSI on status or a partition strategy like STATUS#OPEN with case IDs as sort keys lets the UI fetch only live cases. Minute-level full scans reread closed history repeatedly and throttle other municipal workloads sharing the table’s budget.
Keeping the per-minute full-table Scan and only increasing capacity treats the symptom while closed cases keep growing the bill. Adding a FilterExpression to the Scan but still reading every item each minute still consumes read units for items later discarded. Storing open-case flags only in CloudFront custom headers without a keyed DynamoDB access pattern is not a durable case-index design.
Exam caveat: Query requires knowing partition key values—design indexes around real access patterns rather than hoping Scan+filter is “good enough.” For very large open sets, paginate Queries and consider caching summaries. Streams can maintain an open-case projection if fan-out dashboards need it.
Operational check: add a GSI or primary-key design supporting Query of open cases; rewrite the dashboard refresh; compare consumed read capacity before/after; load-test one-minute refresh; and verify closed cases no longer dominate every poll.