
A capacity planner forecasts the appliance's purchase dates by tracking how many bytes the backup application writes to the system each month, yet the appliance keeps filling faster or slower than those forecasts predicted. Which monitoring change produces usable forecasts on a deduplicating appliance?
Select an answer to reveal the explanation.
Short Explanation
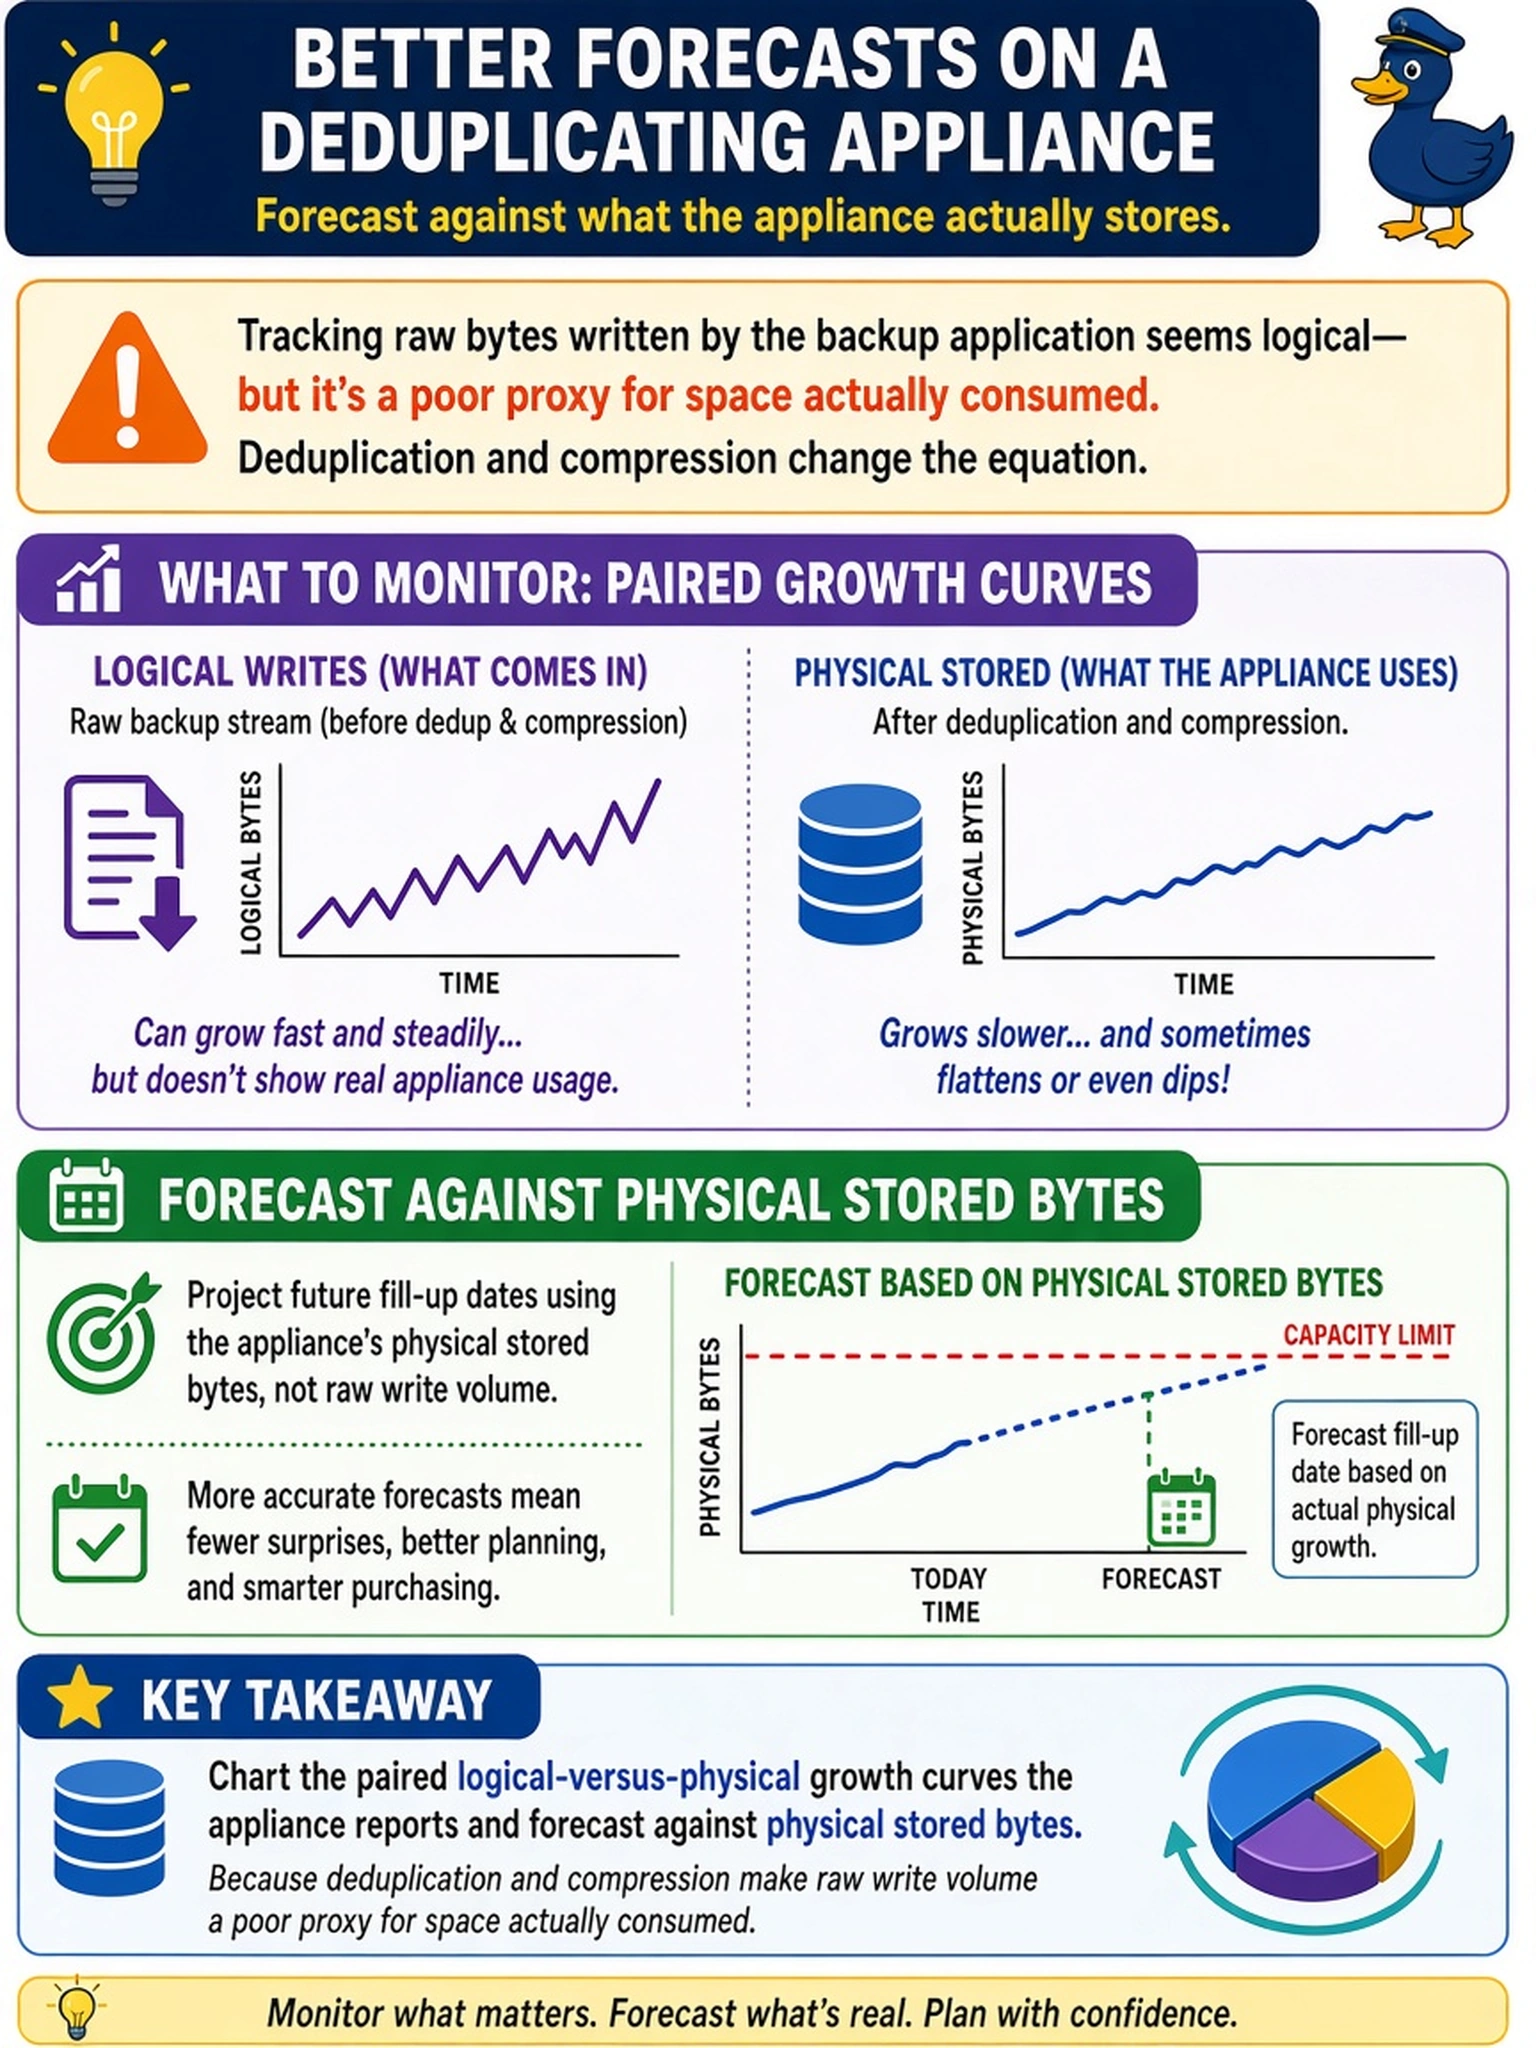
Here's the trap: bytes in are not bytes stored. On a deduplicating system the reduction factor moves with the data, so your write-based forecast drifts every time someone adds a new fleet of VMs. Watch the physical trend - the stored-bytes curve - and plan against what actually lands on disk.
Full Explanation
Deduplicating appliances report two distinct growth series: logical data, roughly what the application wrote, and physical usage, what remains after deduplication and compression. The reduction factor between them is a property of the data, and it shifts whenever the data mix changes - image-based backups or encrypted sources erode dedup and make physical space disappear faster than write counts suggest. Usable forecasting therefore monitors the physical trend as the purchasing curve, with the logical-to-physical gap as an early warning of mix change. Defending the write-stream method gets the mechanism backwards: reduction absolutely changes the physical footprint, and that changing ratio is precisely why the spreadsheet kept missing. Throughput is a rate while capacity is cumulative - peak write speed informs bandwidth sizing, not fill dates, and 'throughput times windows' ignores retention, churn, and reduction entirely. Fleet-average forecasts blur systems that mature on different schedules; procurement happens per chassis, so one appliance hitting full inside a healthy-looking average is a surprise nobody planned for. Exam caveat: after onboarding a new application type, re-baseline the physical trend - last year's growth rate is only valid for last year's data mix. Operational check: plot physical used bytes over twelve months, derive a monthly growth figure, compute the full date against usable capacity, and compare it with the write-based sheet's prediction.