When inspecting a multi-class confusion matrix, what does it indicate if the values along the main diagonal are large relative to the off-diagonal values?
Select an answer to reveal the explanation.
Short Explanation and Infographic
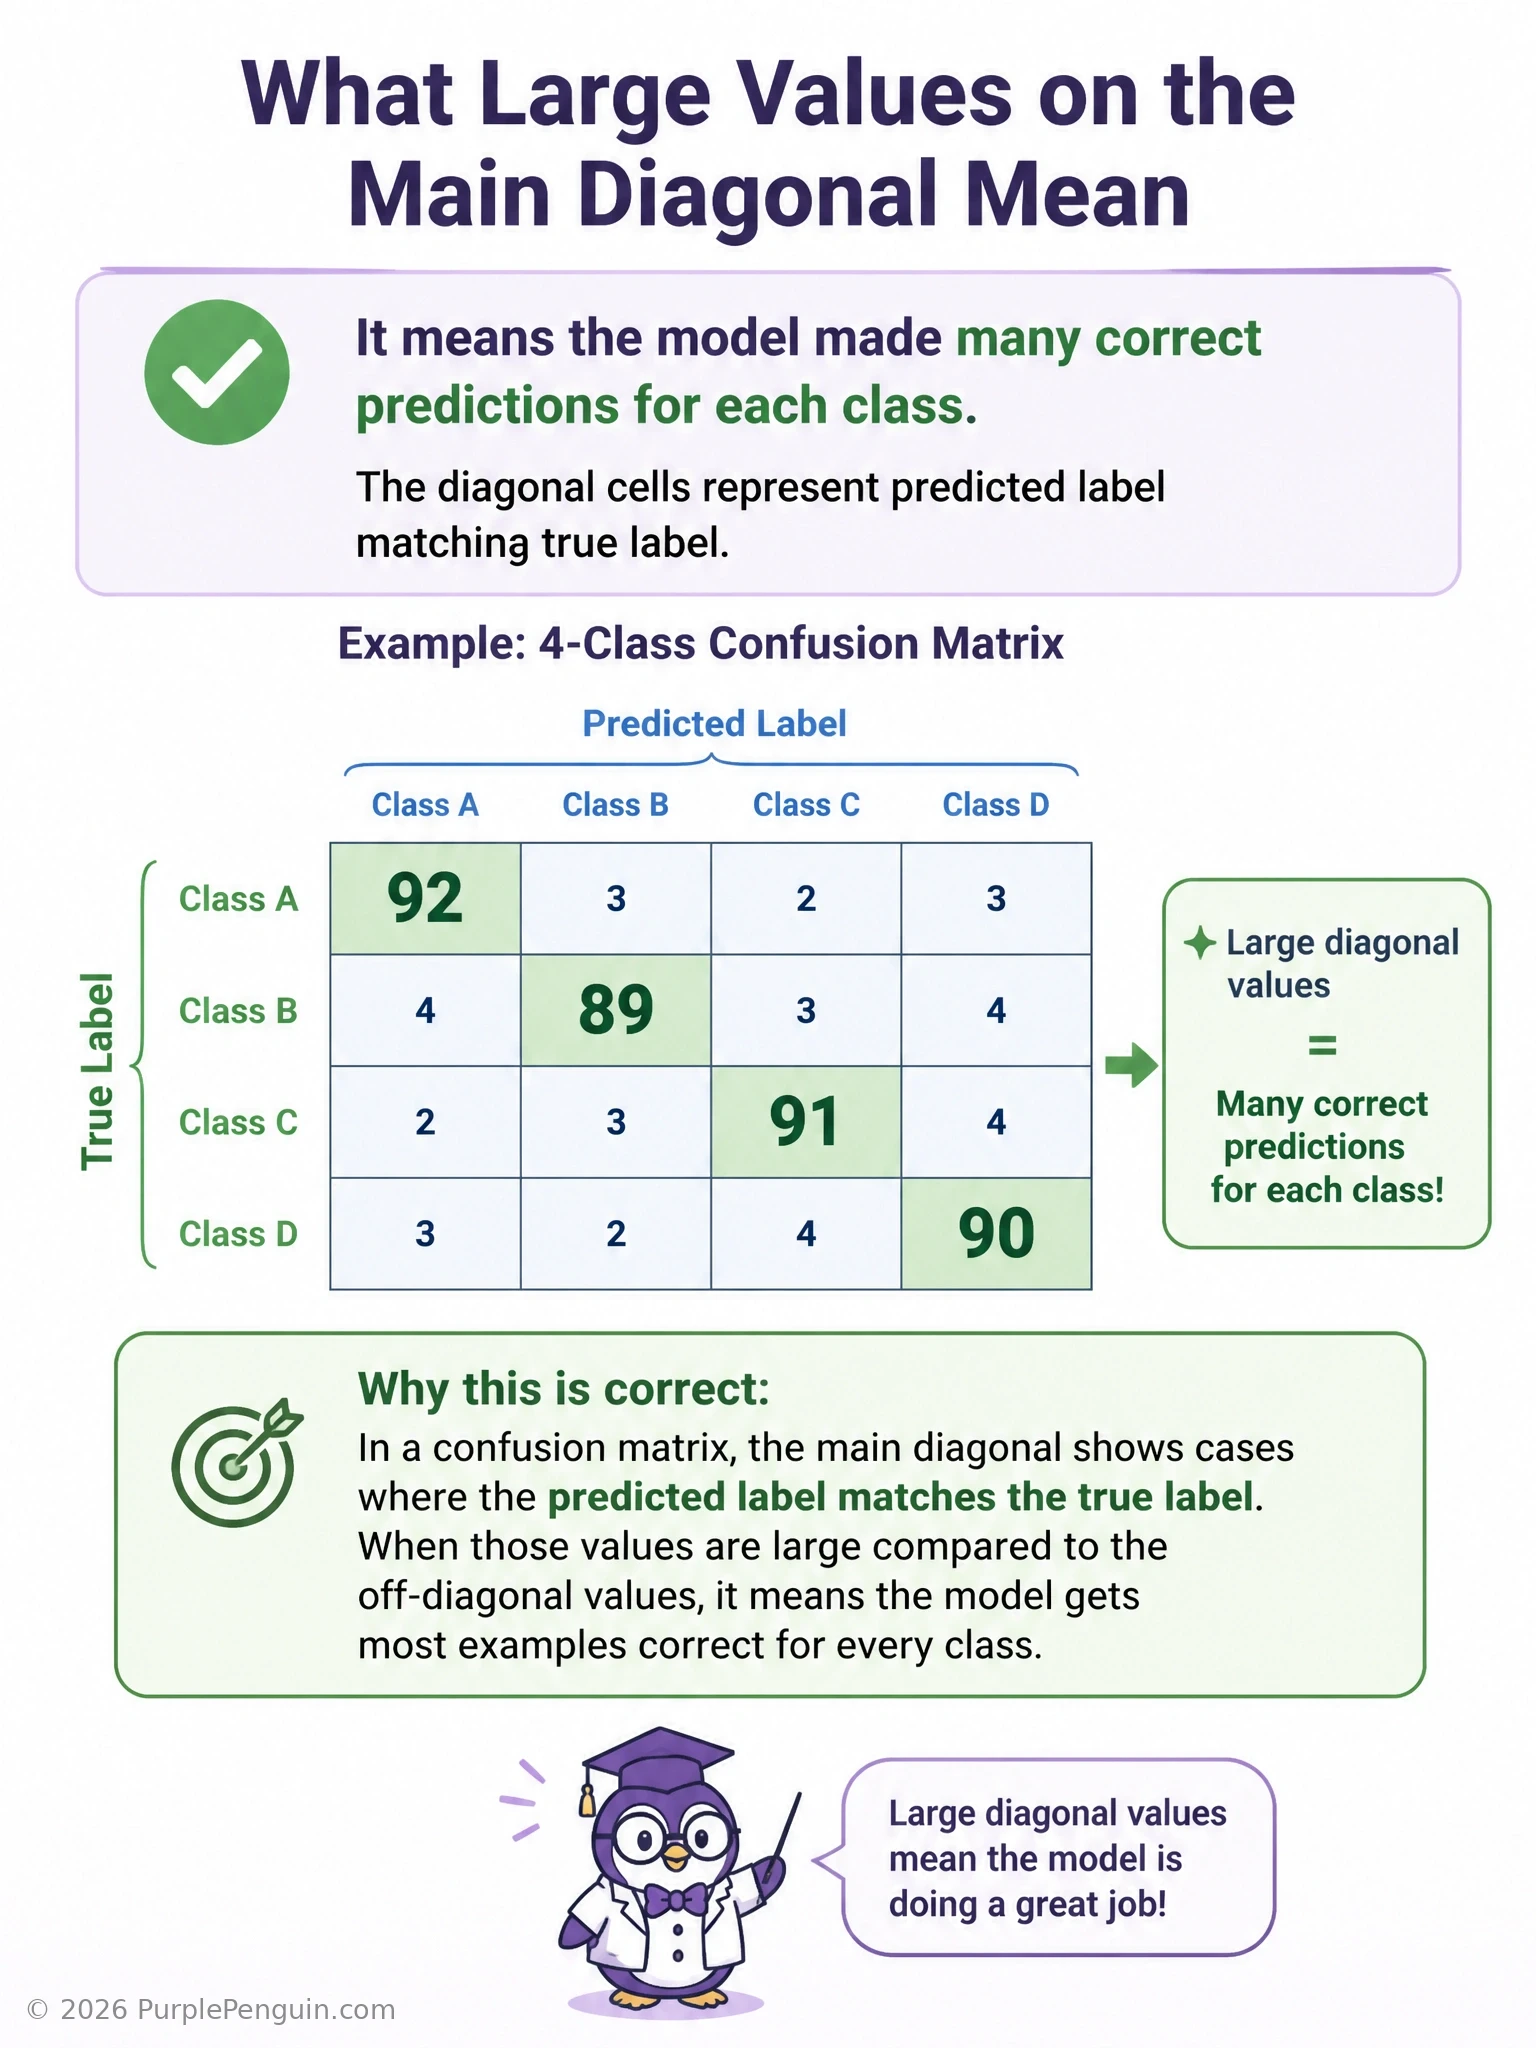
Here's how to read a confusion matrix fast: each row is usually the true class, each column the predicted class, and the diagonal cells are where true and predicted line up — meaning the model got it right. So if those diagonal numbers are big compared to everything off the diagonal, the model's nailing its predictions across the board, class by class. That's answer C. It's not directly about overfitting — a confusion matrix alone doesn't compare training to test performance, you'd need both sets side by side. It's not about learning rate either; that affects training dynamics, but the matrix is a snapshot of final predictions. And it's not specifically about class imbalance — that's a property of your data counts, not something the diagonal pattern tells you directly.
Full explanation below image
Full Explanation
A confusion matrix for a multi-class problem is typically laid out with true classes as rows and predicted classes as columns, so that cell (i, j) records how many examples of true class i were predicted as class j. The main diagonal, where the true class index equals the predicted class index, therefore represents every case the model classified correctly. When the diagonal values are large relative to the off-diagonal values, it means the vast majority of predictions matched their true labels across every class, indicating strong overall classification performance and relatively few misclassifications between any pair of classes.
The model being heavily overfit to the training set is incorrect as an inference from a single confusion matrix, because overfitting is detected by comparing performance between a training set and a separate validation or test set — a strong diagonal on just one evaluation set (particularly if it is the test set) is actually evidence of good generalization, not overfitting, and a confusion matrix computed only on training data would tell you nothing about how the model performs on unseen data without a second matrix for comparison. The learning rate being set too high during training is incorrect because the confusion matrix reflects only the final trained model's prediction outcomes; it contains no information about the training dynamics, loss curve shape, or hyperparameter values used to get there, so it cannot be used to diagnose a learning rate problem directly. The dataset containing far more negative examples than positive ones is incorrect because class imbalance is a property of the label distribution in the dataset itself (visible from the row or column totals), not something inferred purely from the diagonal-to-off-diagonal ratio; a model could have strong or weak diagonal values on either a balanced or an imbalanced dataset.
A good habit when reading confusion matrices for multi-class problems is to also examine which off-diagonal cells are non-trivial, since those reveal exactly which classes the model tends to confuse with each other (for example, consistently mistaking one visually similar class for another), information that a single scalar metric like accuracy or an aggregate F1 score cannot provide on its own.