
A dataset of household incomes shows most values clustered at the lower end, with a small number of very high-income outliers stretching the distribution's tail far out to the right. How would a data scientist describe the shape of this distribution?
Select an answer to reveal the explanation.
Short Explanation
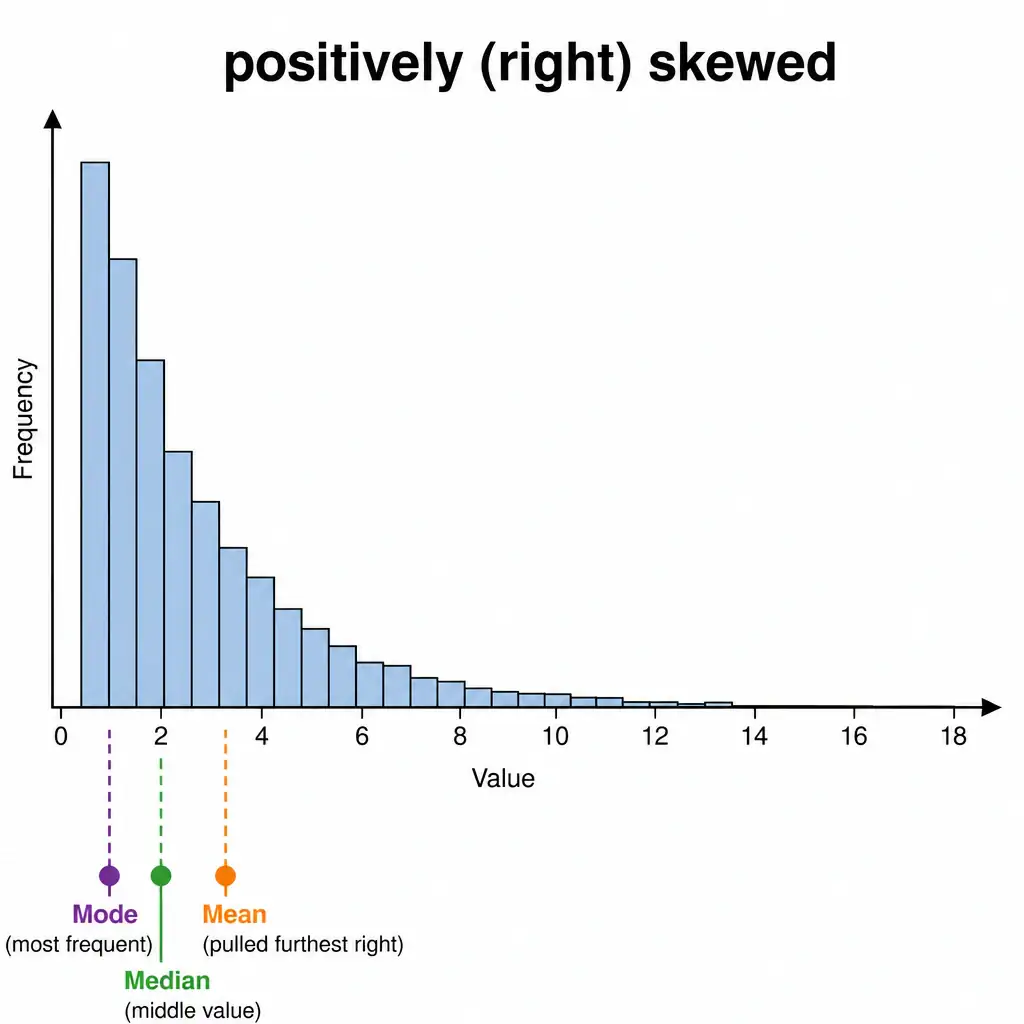
Here's the trick people get backwards: the skew is named after where the long tail points, not where most of the data piles up. Since the tail here stretches out to the right (a few huge incomes way out past everyone else), this is positively, or right, skewed — that's answer C, and household income is actually the classic textbook example of it. Negatively (left) skewed would mean the long tail stretches out to the left instead, with outliers on the low end — the opposite situation. Uniformly distributed means every value is roughly equally likely, no clustering and no tail at all. And perfectly symmetric would mean both sides mirror each other, which clearly isn't happening when most people cluster low and a few outliers stretch way out to one side.
Full Explanation
Skewness describes the asymmetry of a distribution. A distribution is positively (right) skewed when it has a long tail extending toward higher values, even though the bulk of the data is clustered at the lower end; visually, the "tail" points to the right. This is precisely the scenario described: most households cluster at lower incomes, while a small number of very high earners pull the tail far to the right. Income, wealth, and many count-based or wait-time datasets are canonical real-world examples of right-skewed distributions, and this skew is also why the mean of such data tends to sit higher than the median, since the extreme high values pull the average up while the median remains anchored near the bulk of typical observations.
The first distractor, negatively (left) skewed, describes the mirror-image situation: a long tail extending toward lower values, with the bulk of data clustered at the higher end (for example, age at retirement, where most people cluster near a typical retirement age but a few retire very early). That is the opposite of the pattern described in the question.
The second distractor, uniform distribution, describes data where every value (or range of values) is equally likely, producing a flat, rectangular-shaped density with no clustering and no directional tail at all — clearly inconsistent with the clustering-plus-outliers pattern described.
The fourth distractor, perfectly symmetric (normal), would require the distribution's left and right halves to mirror each other, with mean, median, and mode coinciding. The presence of a stretched-out tail on only one side directly rules out symmetry.
Memory aid: "the tail tells the tale" — whichever direction the long thin tail points is the direction of the skew's name, regardless of where the bulk of the data sits.