A data scientist plots the distribution of a feature and confirms it is a perfect normal (Gaussian) distribution. Based on this alone, what can she conclude about the relationship between the mean, median, and mode of the feature?
Select an answer to reveal the explanation.
Short Explanation and Infographic
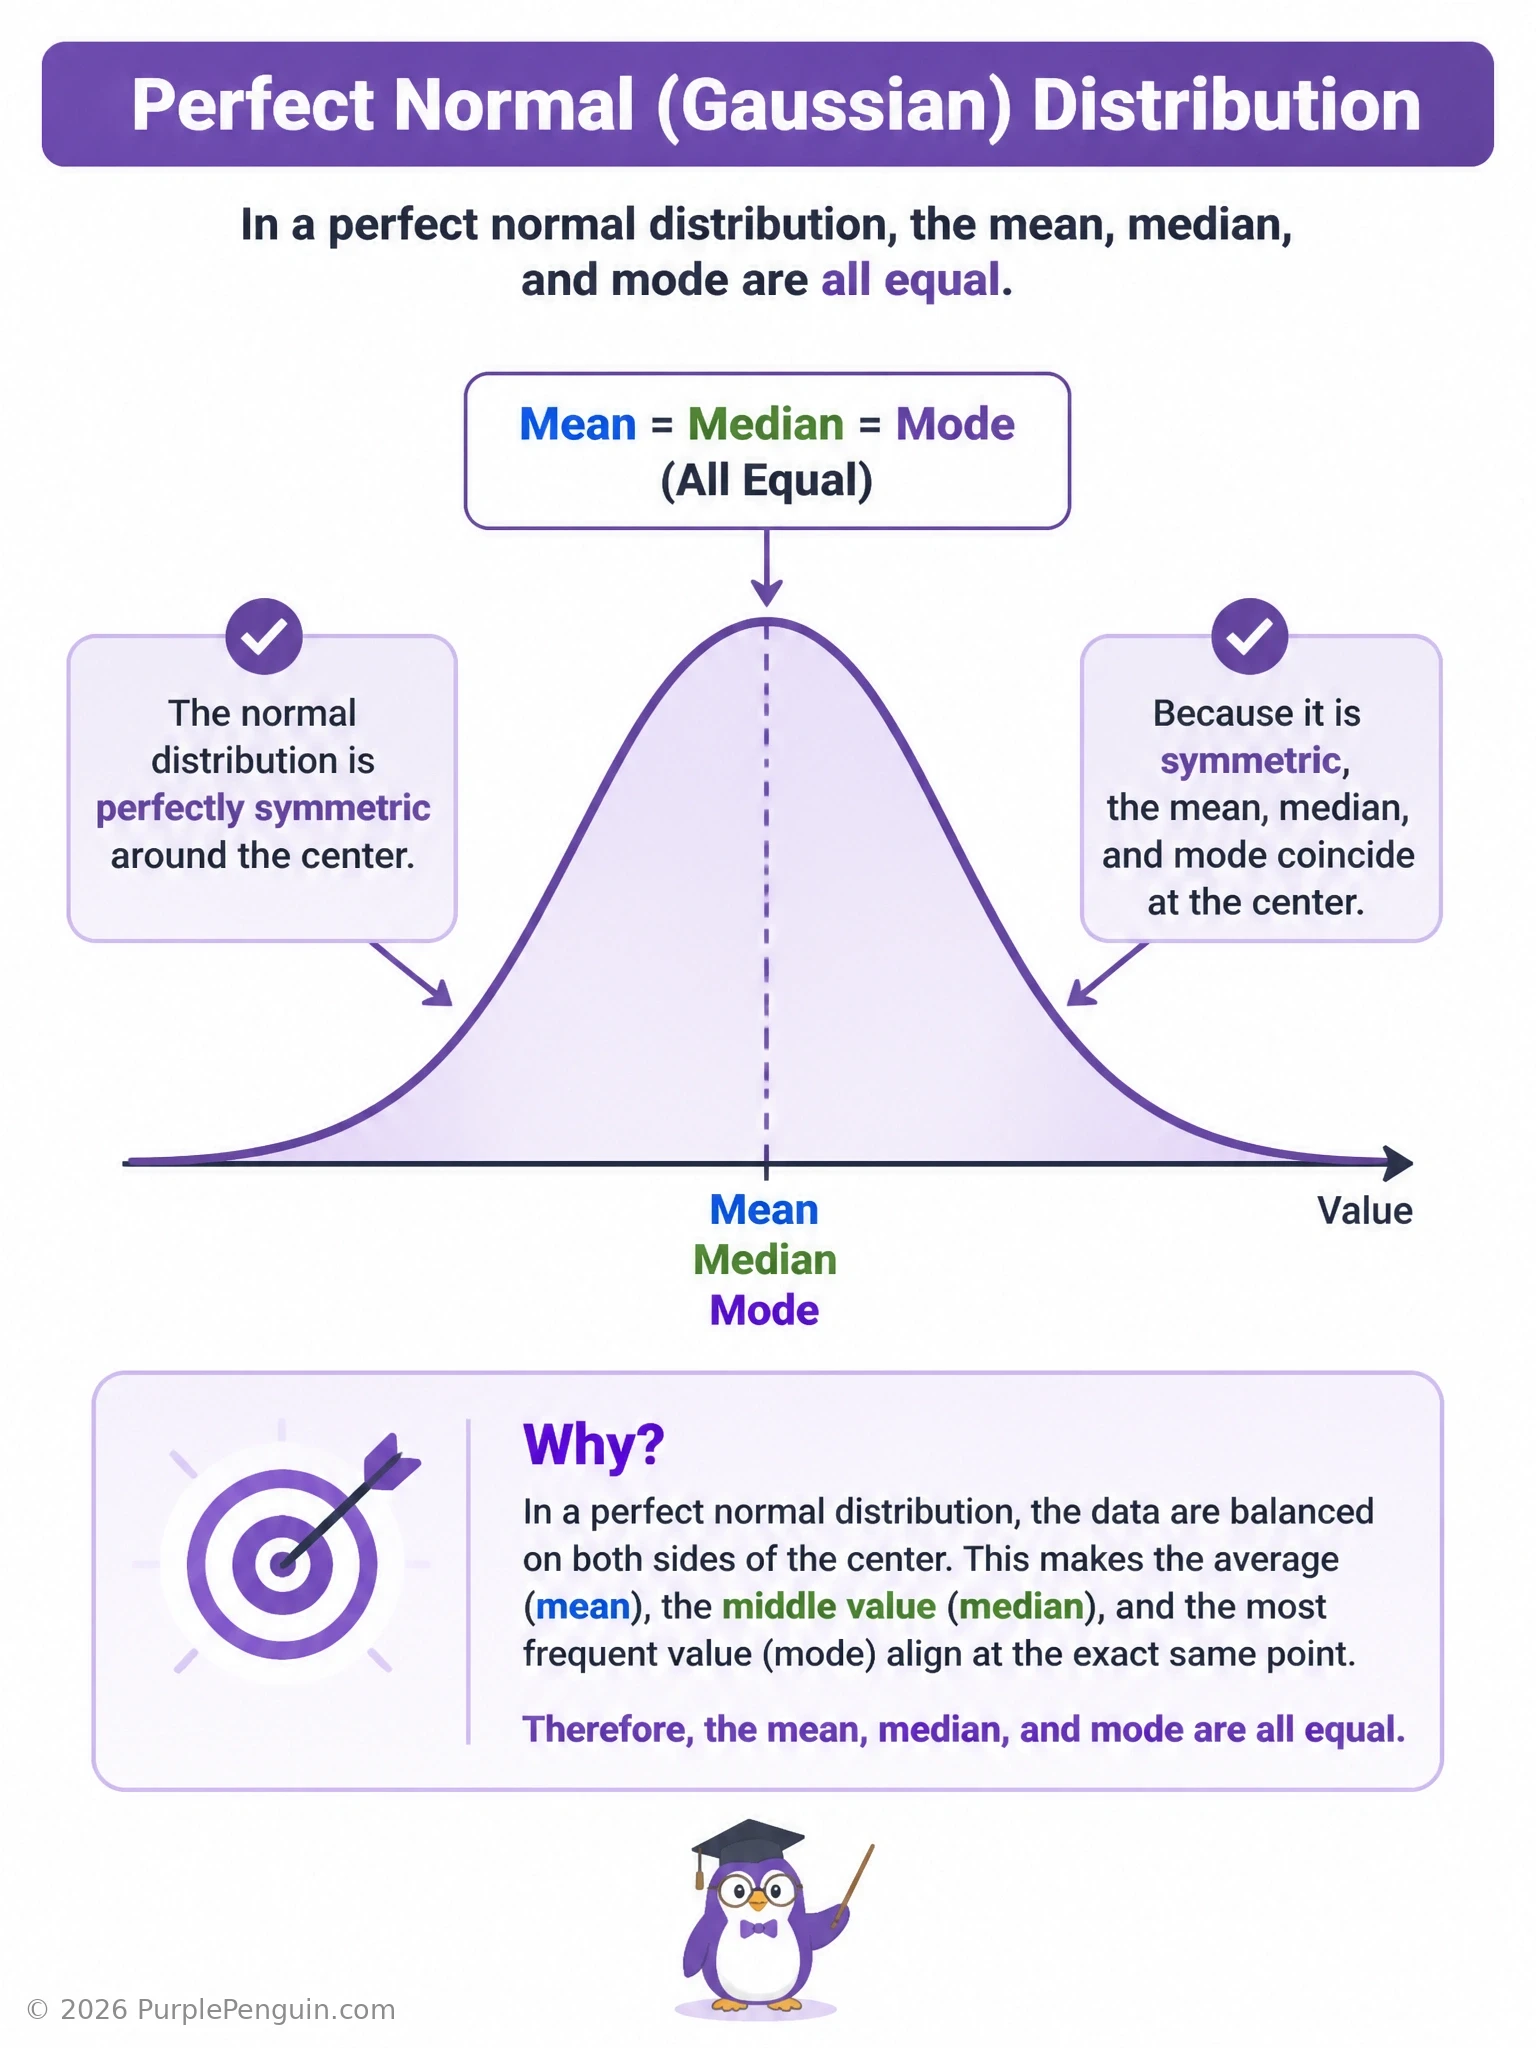
Picture a perfect bell curve, folded right down the middle — the two halves match exactly. That symmetry is the whole story here. When a distribution is symmetric like the normal distribution, the balancing point (mean), the middle value (median), and the most frequent value (mode, at the peak) all land on that same central line. So the answer is A: they're all equal. The 'mean greater than median greater than mode' ordering you might remember is for skewed distributions, not symmetric ones — that's a trap if you're pattern-matching too fast. And no, a continuous distribution absolutely still has a mode; it's just the peak of the curve, not a repeated observed value. The min/max midpoint claim isn't a real statistical property at all — it just sounds plausible.
Full explanation below image
Full Explanation
The normal (Gaussian) distribution is defined by perfect symmetry around its center. Because the probability density falls off identically in both directions from that center, the three classic measures of central tendency converge on the same point: the mean (the arithmetic average, i.e., the balance point of the distribution), the median (the value splitting the data into two equal-probability halves), and the mode (the value at the peak of the density curve, where probability is highest). This is a defining structural property of the normal distribution, not a coincidence tied to any particular dataset.
The second option describes the ordering mean > median > mode, which is a known heuristic for right-skewed (positively skewed) distributions, where a long right tail pulls the mean upward relative to the median and mode. Applying that ordering to a symmetric distribution is a common error — the whole point of skew statistics is that they only appear when symmetry breaks down. Since the distribution here is explicitly stated to be a perfect normal distribution, there is no skew, so this ordering does not apply.
The third option is incorrect because continuous distributions absolutely have a well-defined mode; it is simply the x-value at which the probability density function reaches its maximum, rather than the most frequently repeated observed value as in a discrete dataset.
The fourth option confuses central tendency with range. The midpoint between the minimum and maximum is the midrange, an entirely different (and much less commonly used) statistic; it is not guaranteed to align with the median in any general distribution, including the normal.
Memory aid: symmetry means agreement. Any time a distribution's left and right halves are mirror images, its center-of-mass, its 50th-percentile point, and its most likely value must all sit at the same location.