
A learning curve showing high train and val error as data grows suggests:
Select an answer to reveal the explanation.
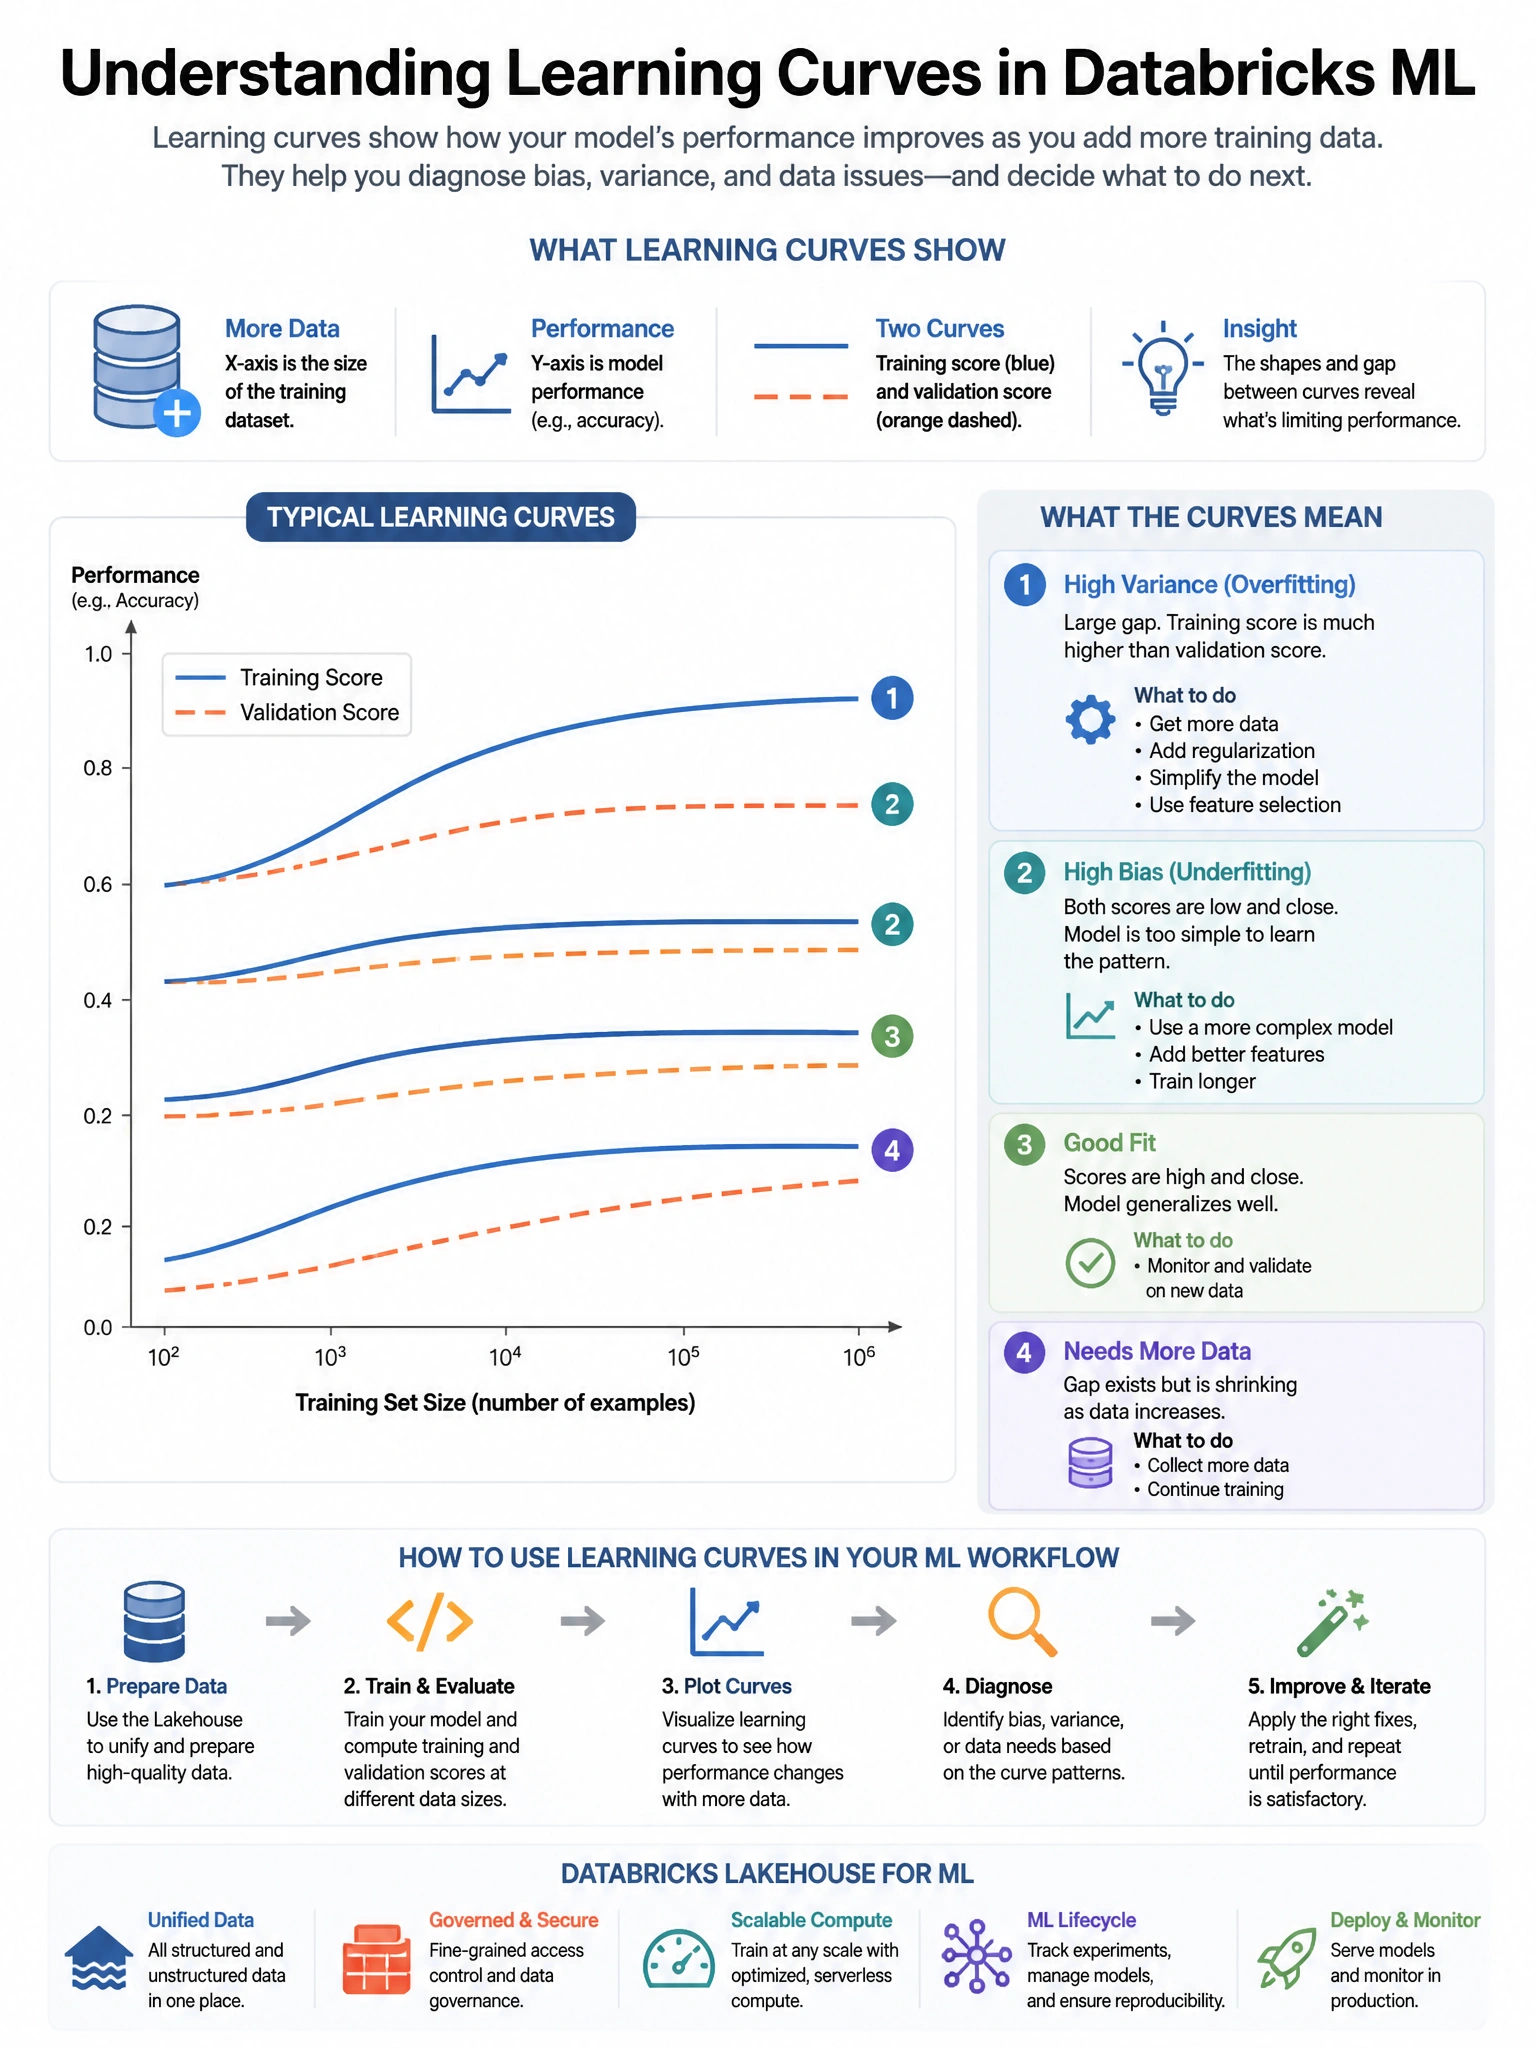
Short Explanation and Infographic
Both errors high → underfit/high bias. Overfit is low train / high val error.
Full explanation below image
Full Explanation
Learning curves diagnose bias-variance qualitatively.