
A learning curve shows training accuracy = 0.95 and validation accuracy = 0.94 with both plateauing as training set size increases. What does this indicate?
Select an answer to reveal the explanation.
Short Explanation and Infographic
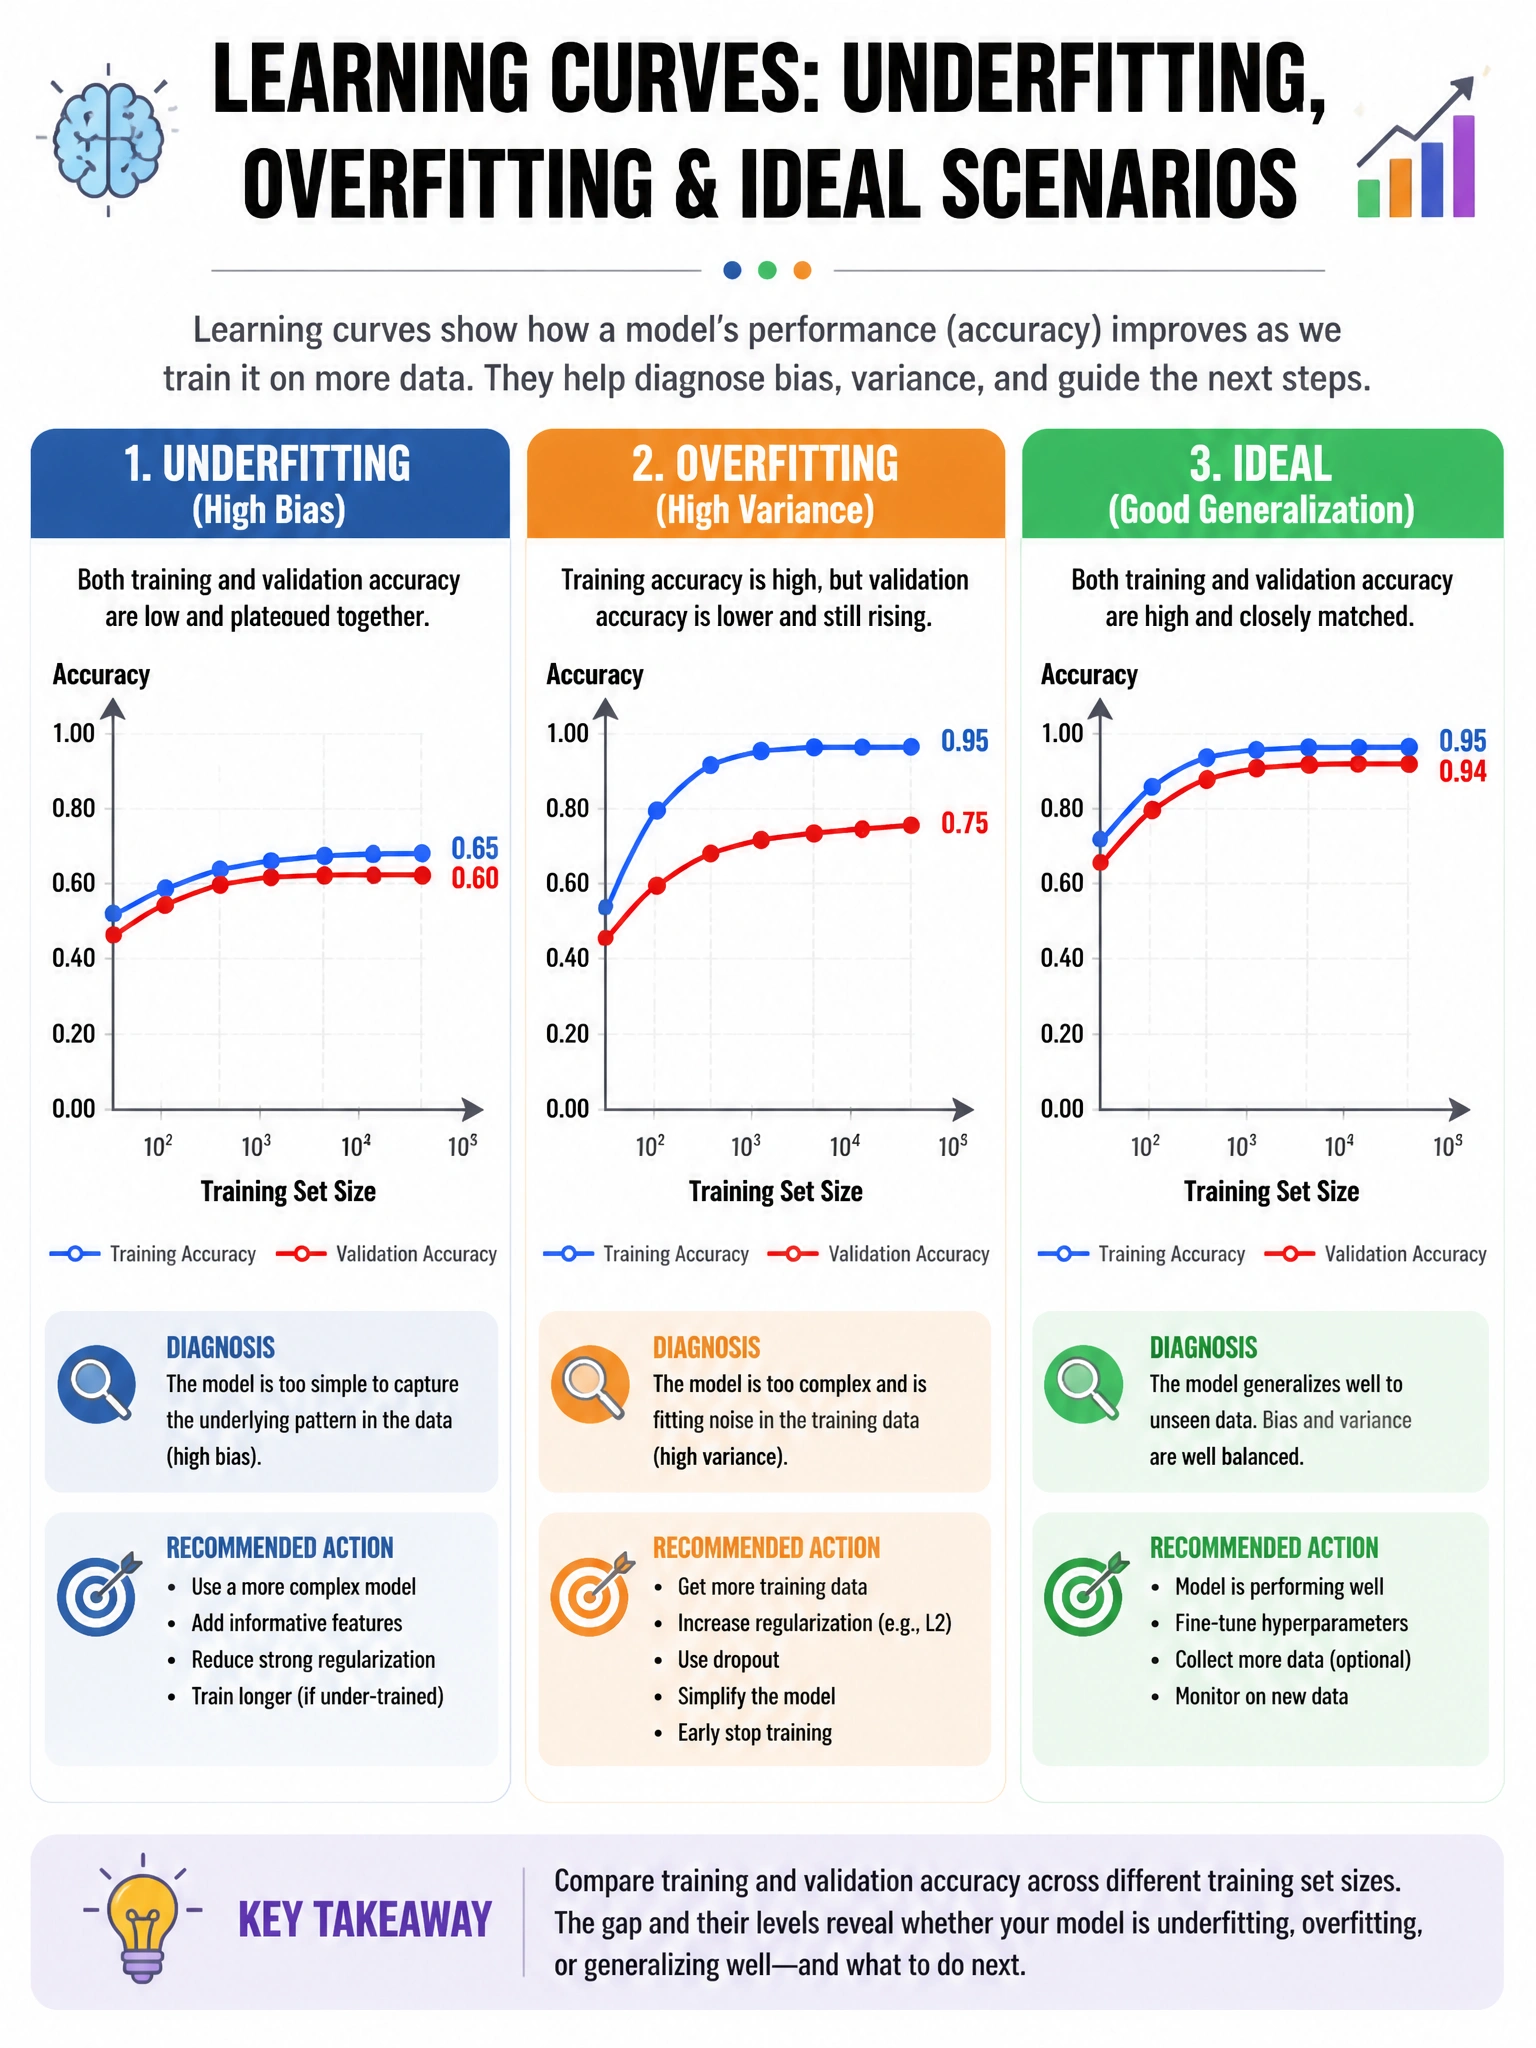
When training and validation accuracy are both high, close together, and plateauing — that's the golden scenario. The model has learned the problem well, and more data won't move the needle much.
Full explanation below image
Full Explanation
Learning curves plot model performance vs training set size. The pattern described (train=0.95, val=0.94, converged, small gap) indicates: Low bias — the model achieves high training accuracy (95%), not limited by model capacity. Low variance — the validation accuracy closely matches training accuracy (only 1% gap). Converged — both curves have plateaued; adding more data won't improve performance significantly. This is the ideal ML outcome. Compare to: Underfitting (high bias): both training and validation accuracy are low (e.g., 60%) and converge to a low ceiling — need more model complexity. Overfitting (high variance): large gap between training (95%) and validation (75%), but validation curve still hasn't plateaued (more data could help close the gap). The plateau is key: if the validation curve is still rising as training size increases, more data will help. If both have plateaued, model architecture changes are needed.