
An ROC curve plots True Positive Rate (Recall) against False Positive Rate. What does an AUC of 0.5 indicate?
Select an answer to reveal the explanation.
Short Explanation and Infographic
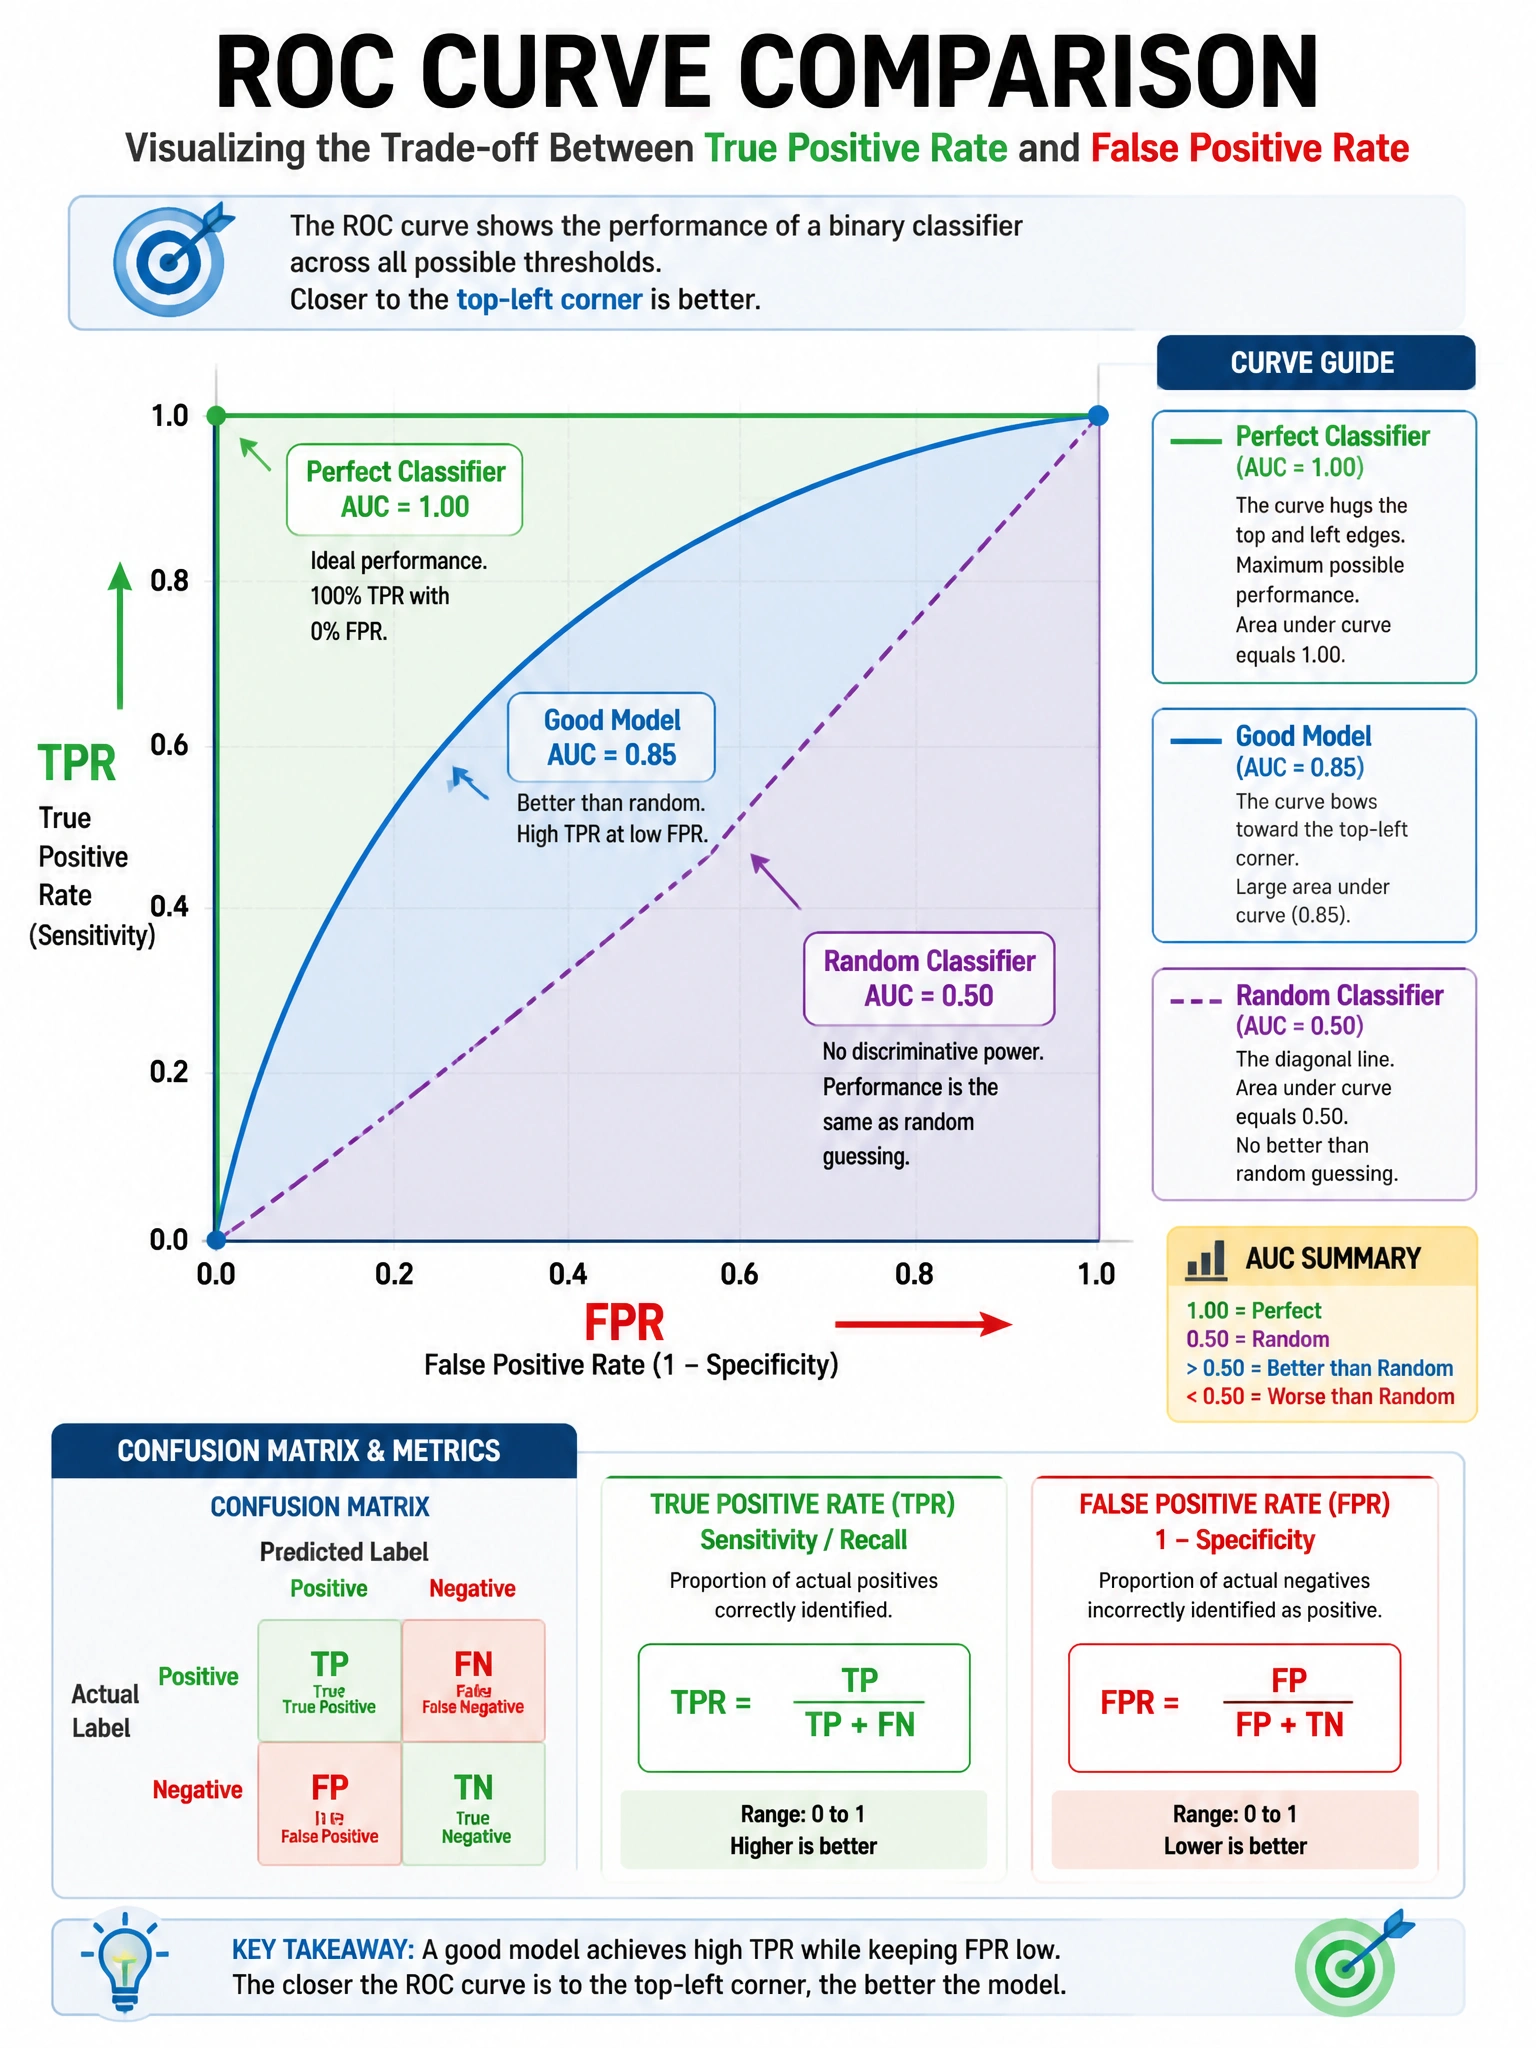
AUC = 0.5 means the ROC curve hugs the diagonal — your model has no discriminating power at all. It's essentially flipping a coin for each prediction.
Full explanation below image
Full Explanation
AUC (Area Under the ROC Curve) ranges from 0 to 1. The ROC curve plots TPR (True Positive Rate = TP/(TP+FN)) on Y axis vs FPR (False Positive Rate = FP/(FP+TN)) on X axis across all classification thresholds. Key AUC values: 1.0 = perfect classifier (curve goes straight up then right, covers entire unit square). 0.5 = random classifier (curve follows the diagonal y=x line). 0.0 = perfectly inverted classifier (always wrong — worse than random). AUC interpretation: 0.5-0.7 poor, 0.7-0.8 acceptable, 0.8-0.9 good, >0.9 excellent. A model that always predicts positive has TPR=1 and FPR=1 at all thresholds — its ROC curve degenerates to the top-right corner, AUC = 0.5. AUC 0.5 does NOT mean 50% precision/recall — those are threshold-dependent metrics whereas AUC is threshold-independent.