
Meridian Line's charter-desk agent performs a retrieval call, then a tool call to look up a counterparty's contract status, then a final LLM call to compose the answer. When a broker reports a wrong answer, the developer wants to see exactly what happened at each of those three steps for that specific request. What MLflow capability provides this?
Select an answer to reveal the explanation.
Short Explanation
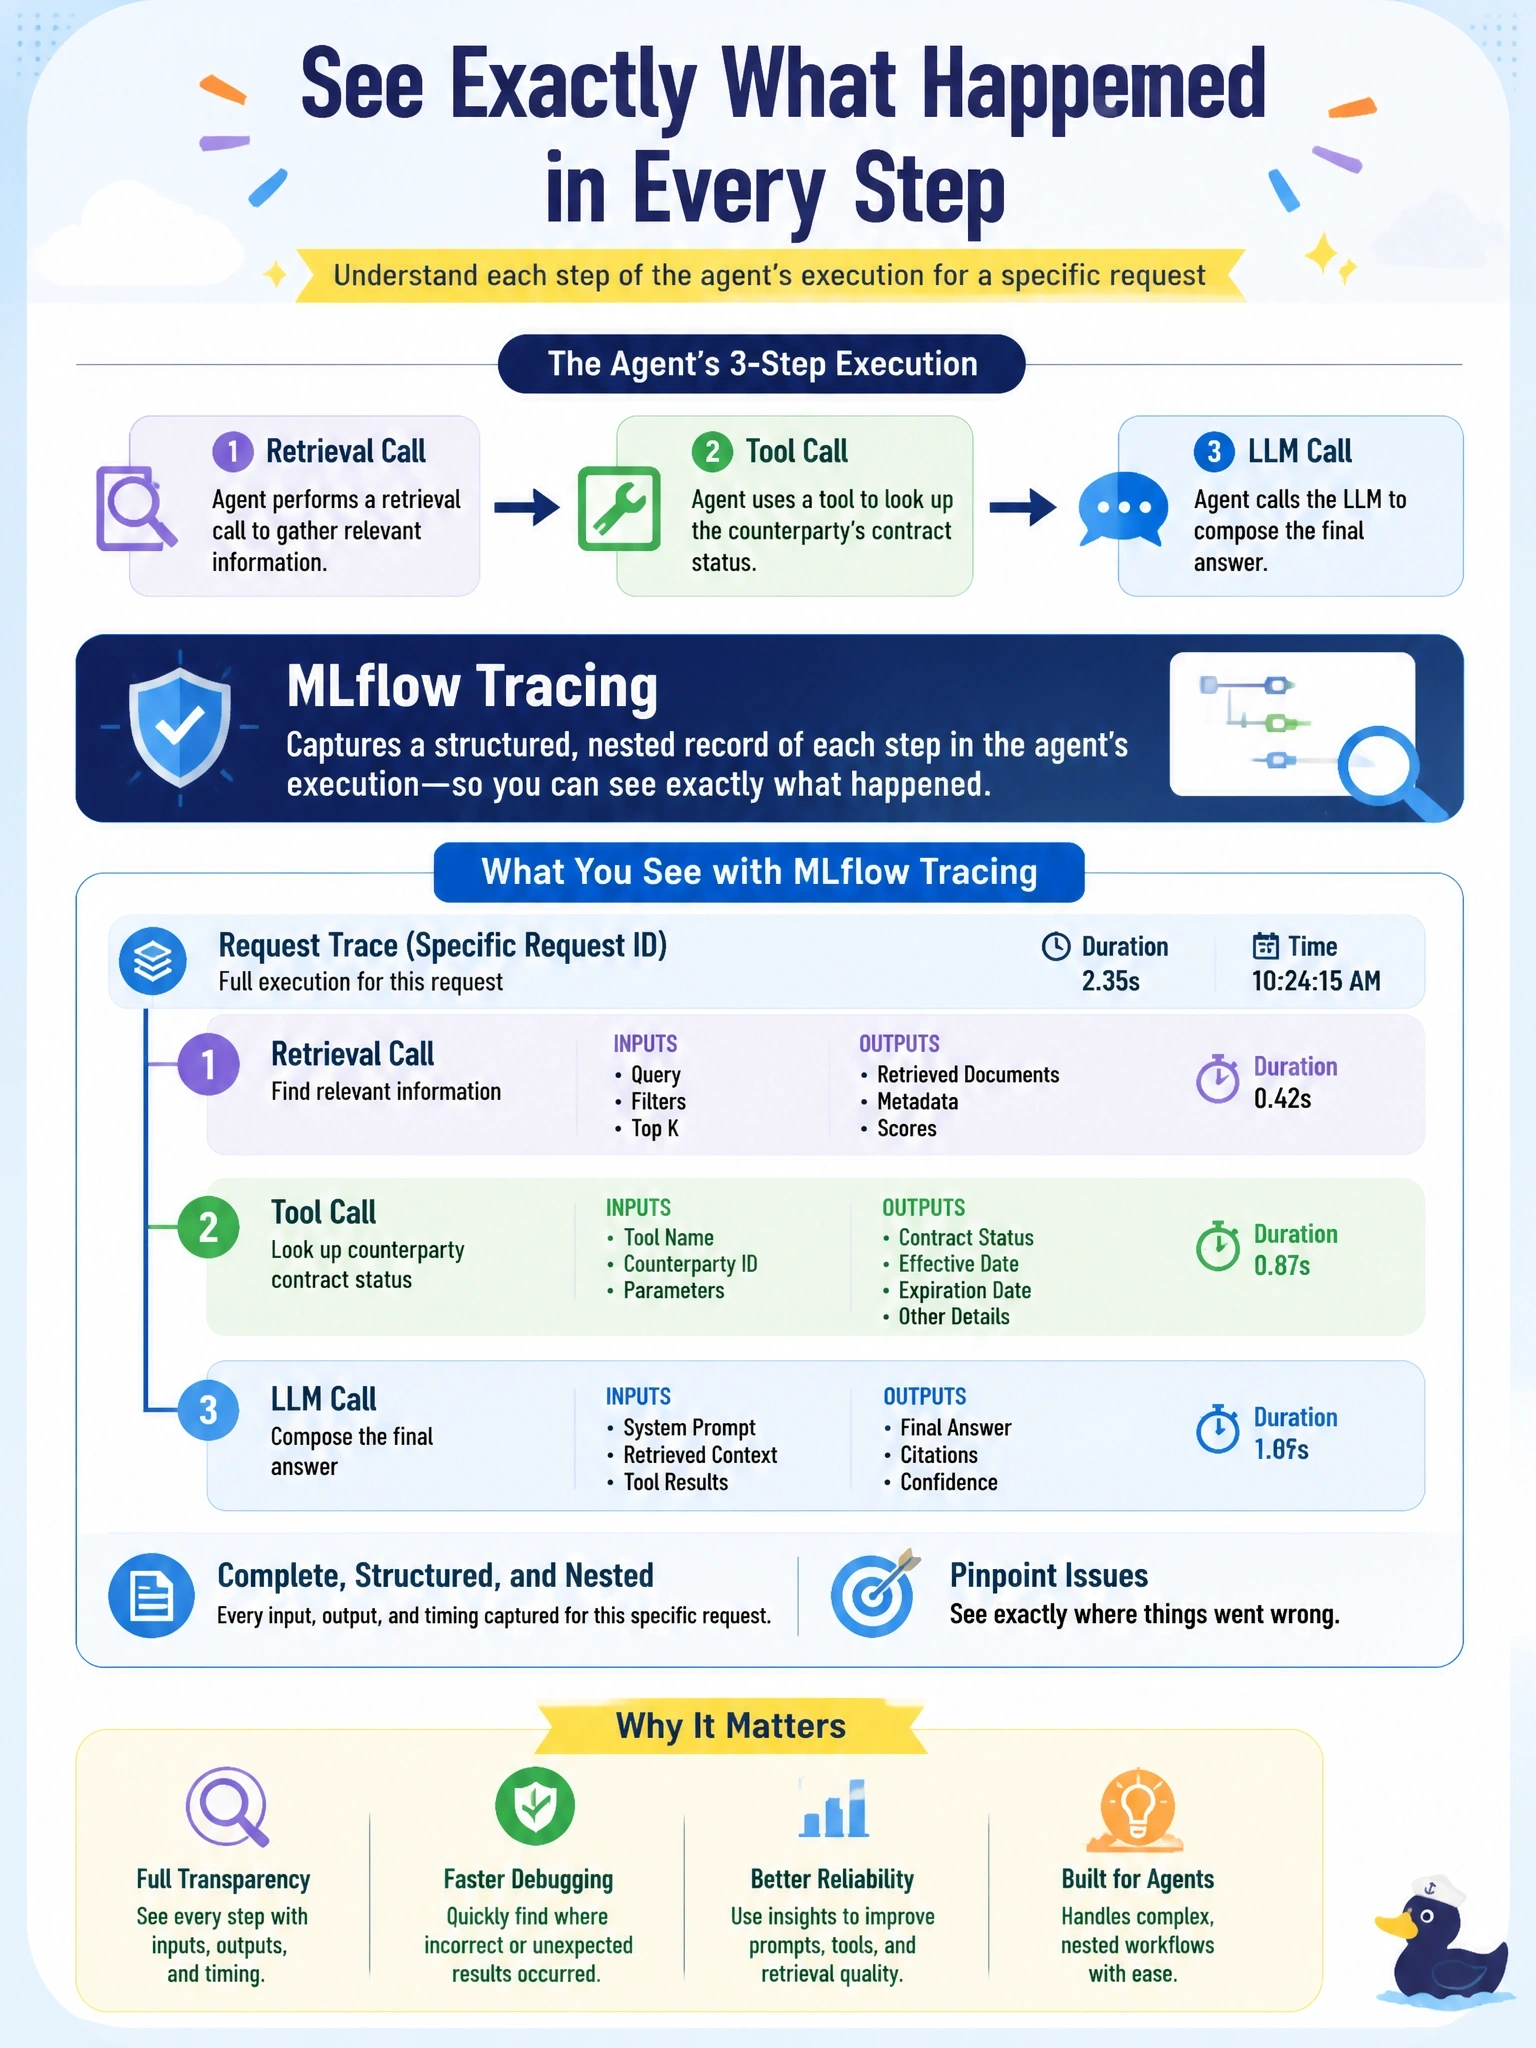
You want a play-by-play of one specific request, retrieval, then tool call, then LLM call, and that's exactly what MLflow Tracing gives you: a nested record of each step with its inputs and outputs, so you can see where the wrong answer actually came from.
Full Explanation
Debugging a specific bad response from a multi-step agent requires visibility into what happened at each step of that particular execution, which is exactly what MLflow Tracing provides, a structured, nested trace capturing the inputs and outputs of each span, the retrieval call, the tool call, and the final LLM call, so the developer can inspect exactly where the wrong information entered the chain. Model Registry aliases track which version of a registered model is currently pointed to by a name like production or champion, which is a deployment-management concept, it says nothing about what happened during execution of one request. Experiment tags are free-text metadata attached to a run for organization and searchability, useful for finding related runs later, but they do not capture step-by-step execution detail for a single request. Model signatures document the expected schema, the shape of inputs and outputs a model accepts and returns, which is useful for catching schema mismatches at deployment time, but a signature describes structure, not what actually happened during one specific agent execution. Exam framing: MLflow Tracing is the mechanism for step-by-step observability into a multi-stage chain or agent's execution, distinct from registry, tagging, or signature features.