
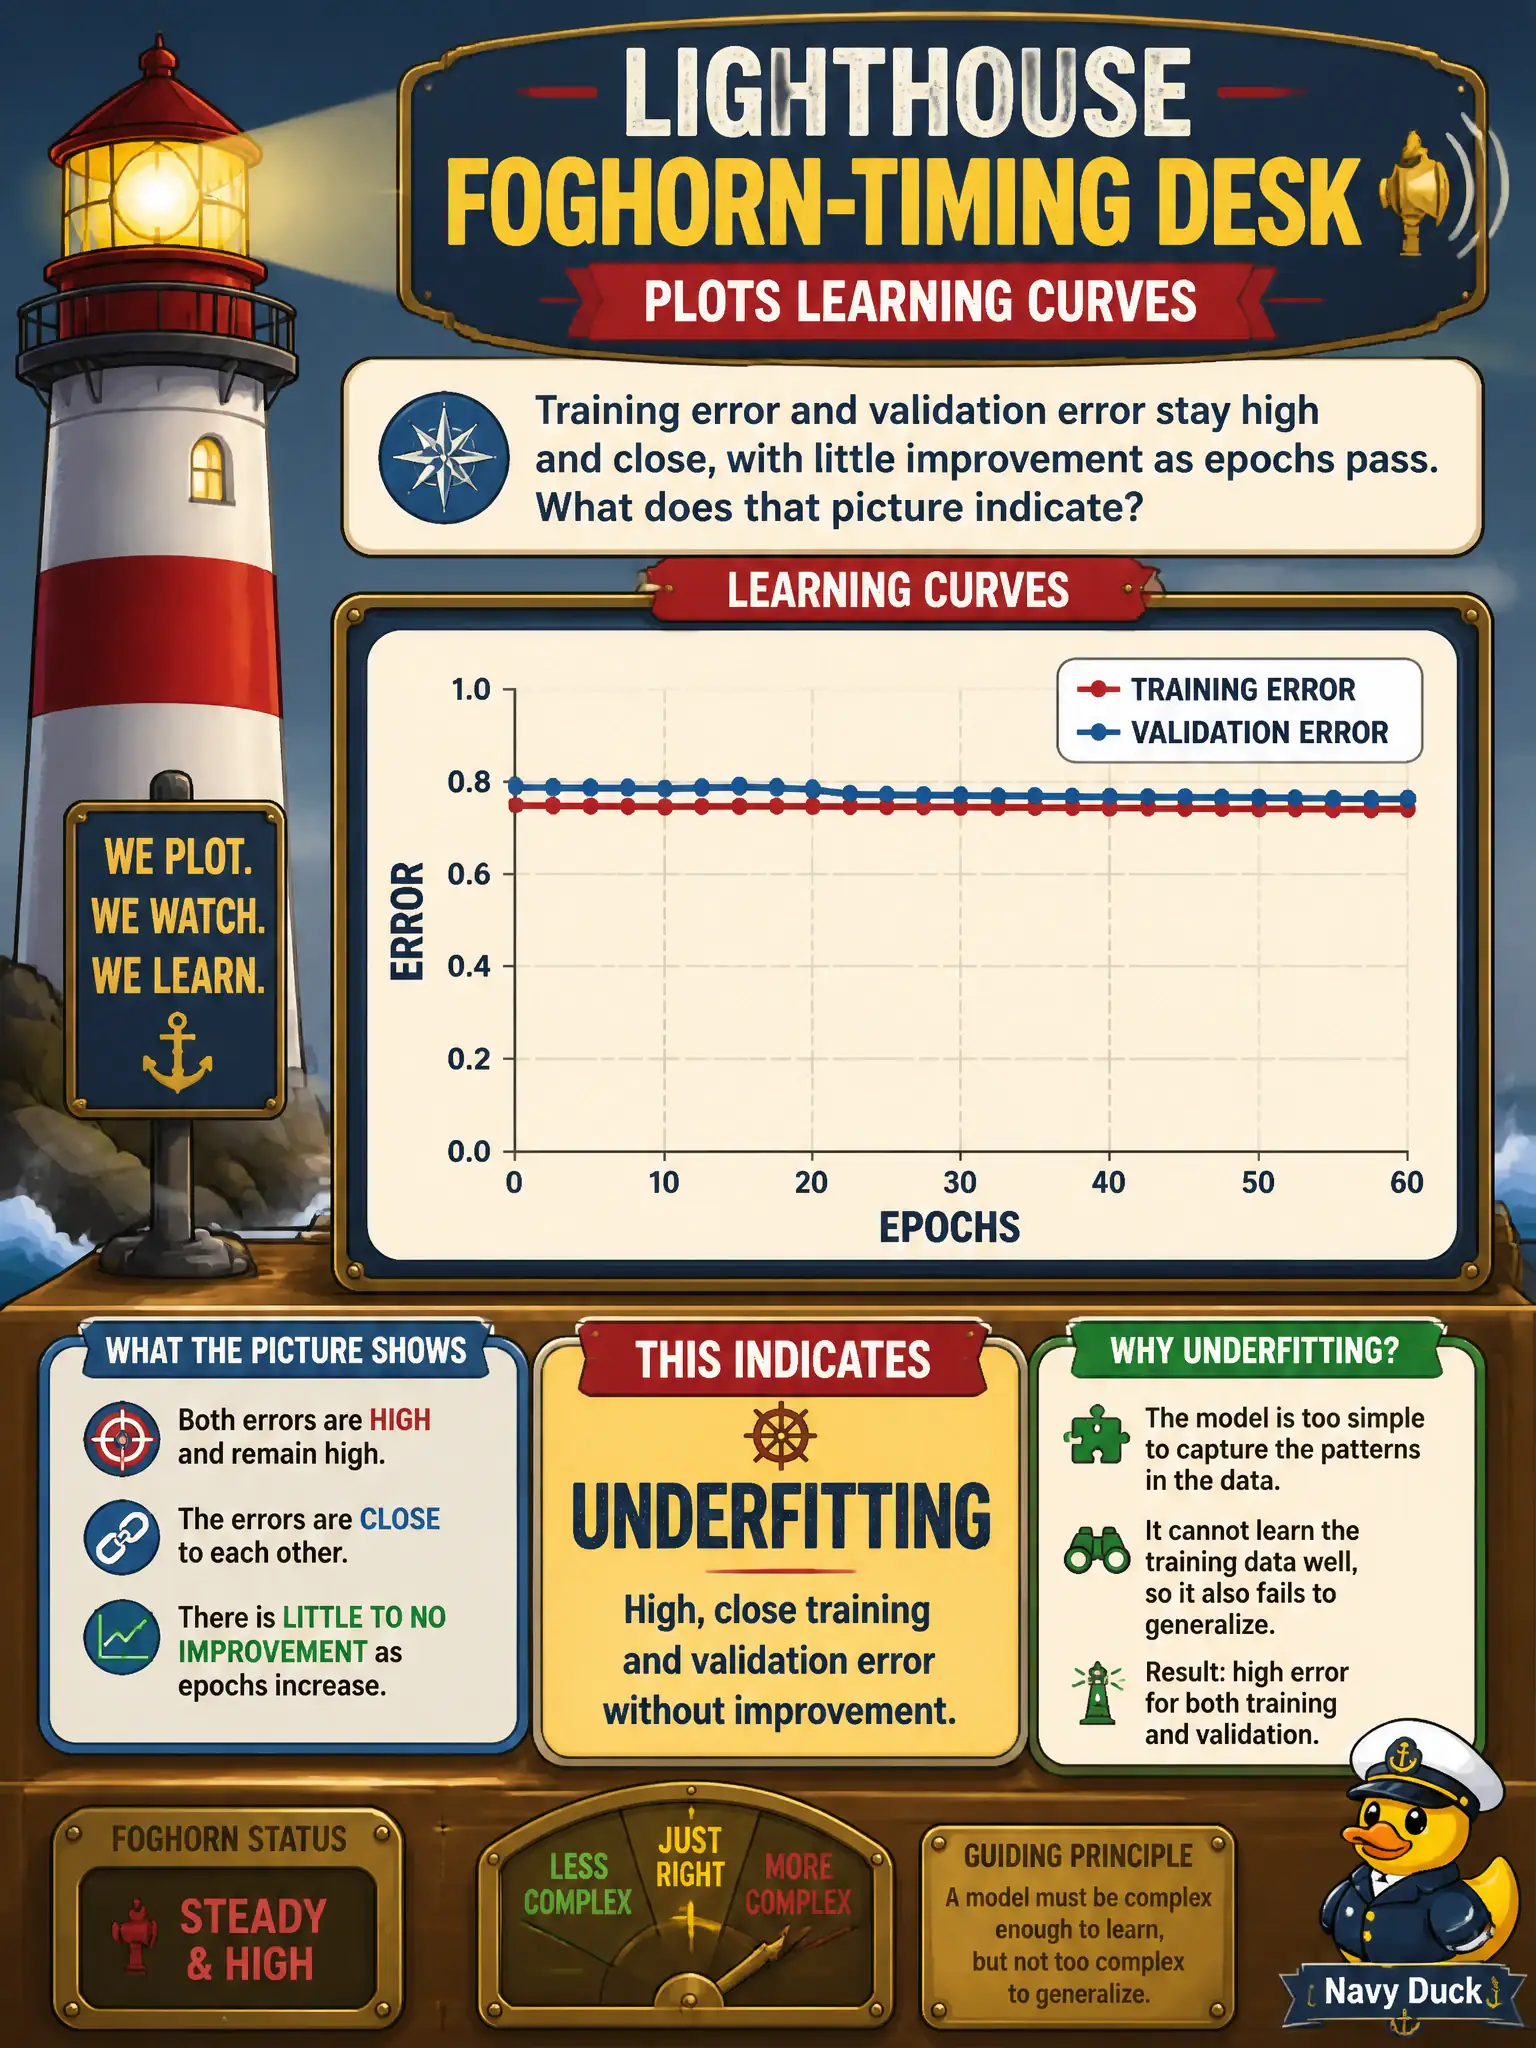
A lighthouse foghorn-timing desk plots learning curves. Training error and validation error stay high and close, with little improvement as epochs pass. What does that picture indicate?
Select an answer to reveal the explanation.
Short Explanation
Learning curves where training error and validation error stay high and close, with little improvement as epochs pass, picture underfitting. Overfitting is a large gap with low training error and high validation error. Close high lines are not a right fit, and late-season ice is a data-drift story, not this plot.
Full Explanation
Learning-curve inspection treats high, close training and validation error without improvement as underfitting. A large overfit gap, data drift, and calling close high lines a right fit miss that picture.