
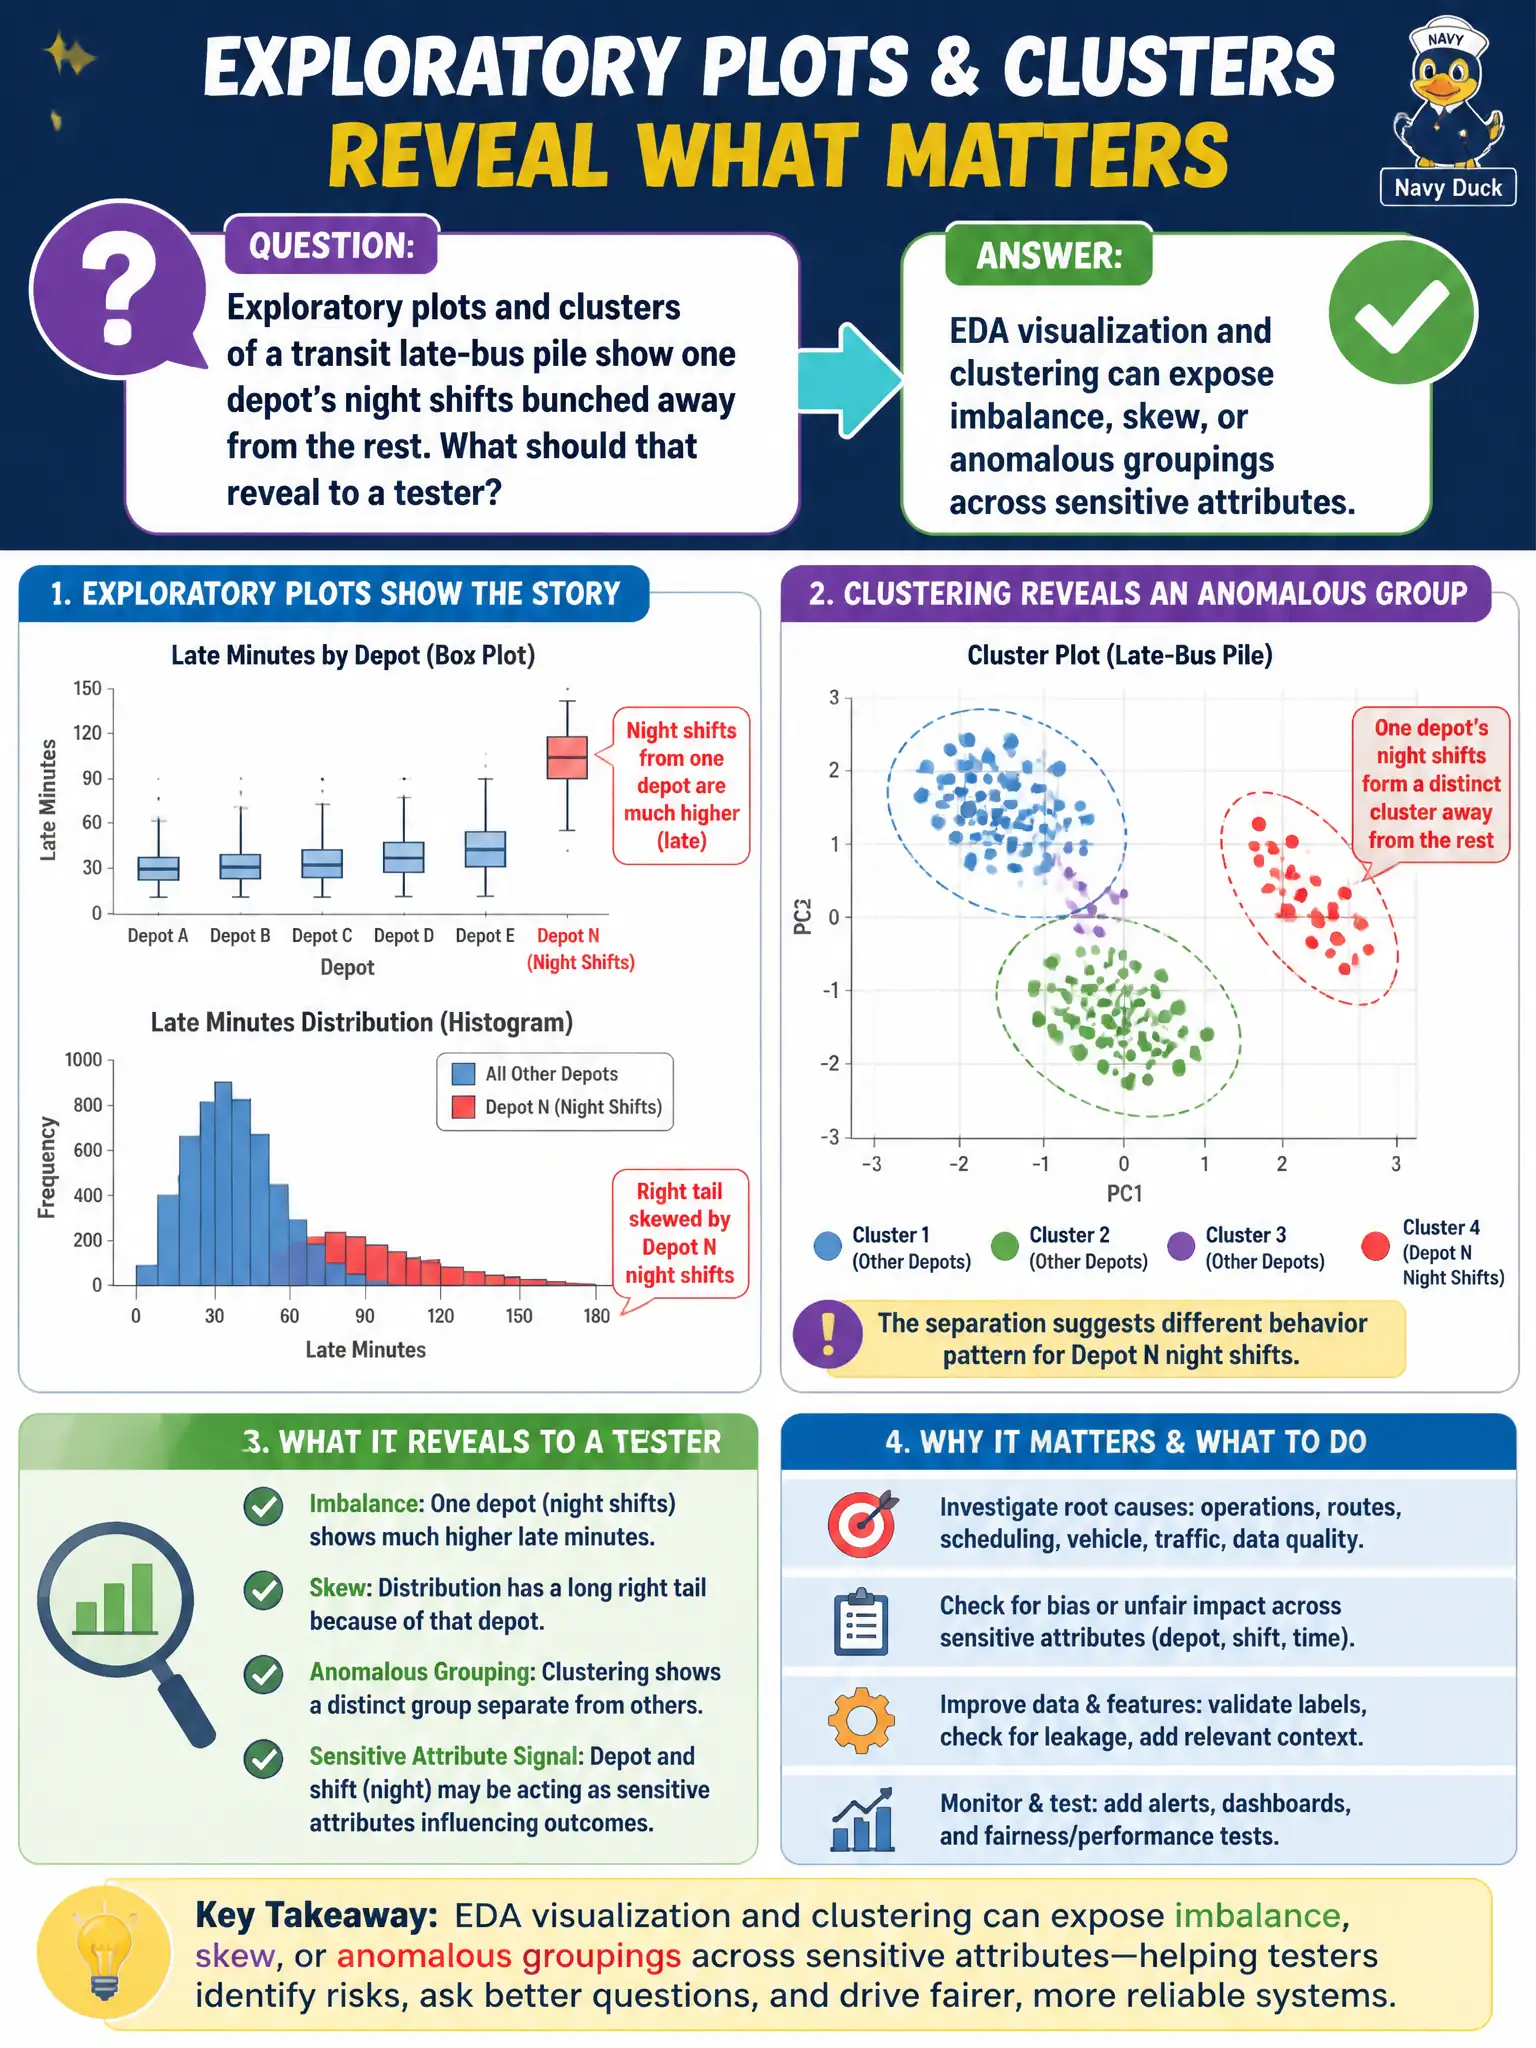
Exploratory plots and clusters of a transit late-bus pile show one depot’s night shifts bunched away from the rest. What should that reveal to a tester?
Select an answer to reveal the explanation.
Short Explanation
Exploratory plots and clusters that bunch one depot’s night shifts away from the rest can expose imbalance, skew, or anomalous groupings across sensitive attributes. That is EDA used as a bias hunt, not a Chapter 6 drift method, not a type-check, and not a fairness certificate just because a plot exists.
Full Explanation
EDA visualization and clustering expose biased structure in training data. Chapter 6 drift, constraint testing, and treating a plot as proof of fairness miss that use.