
The executive leadership team wants a weekly at-a-glance view of the organization's security posture, including open critical vulnerabilities, incident counts, and patch compliance trends, without being interrupted by individual events. Which tool BEST meets this need?
Select an answer to reveal the explanation.
Short Explanation
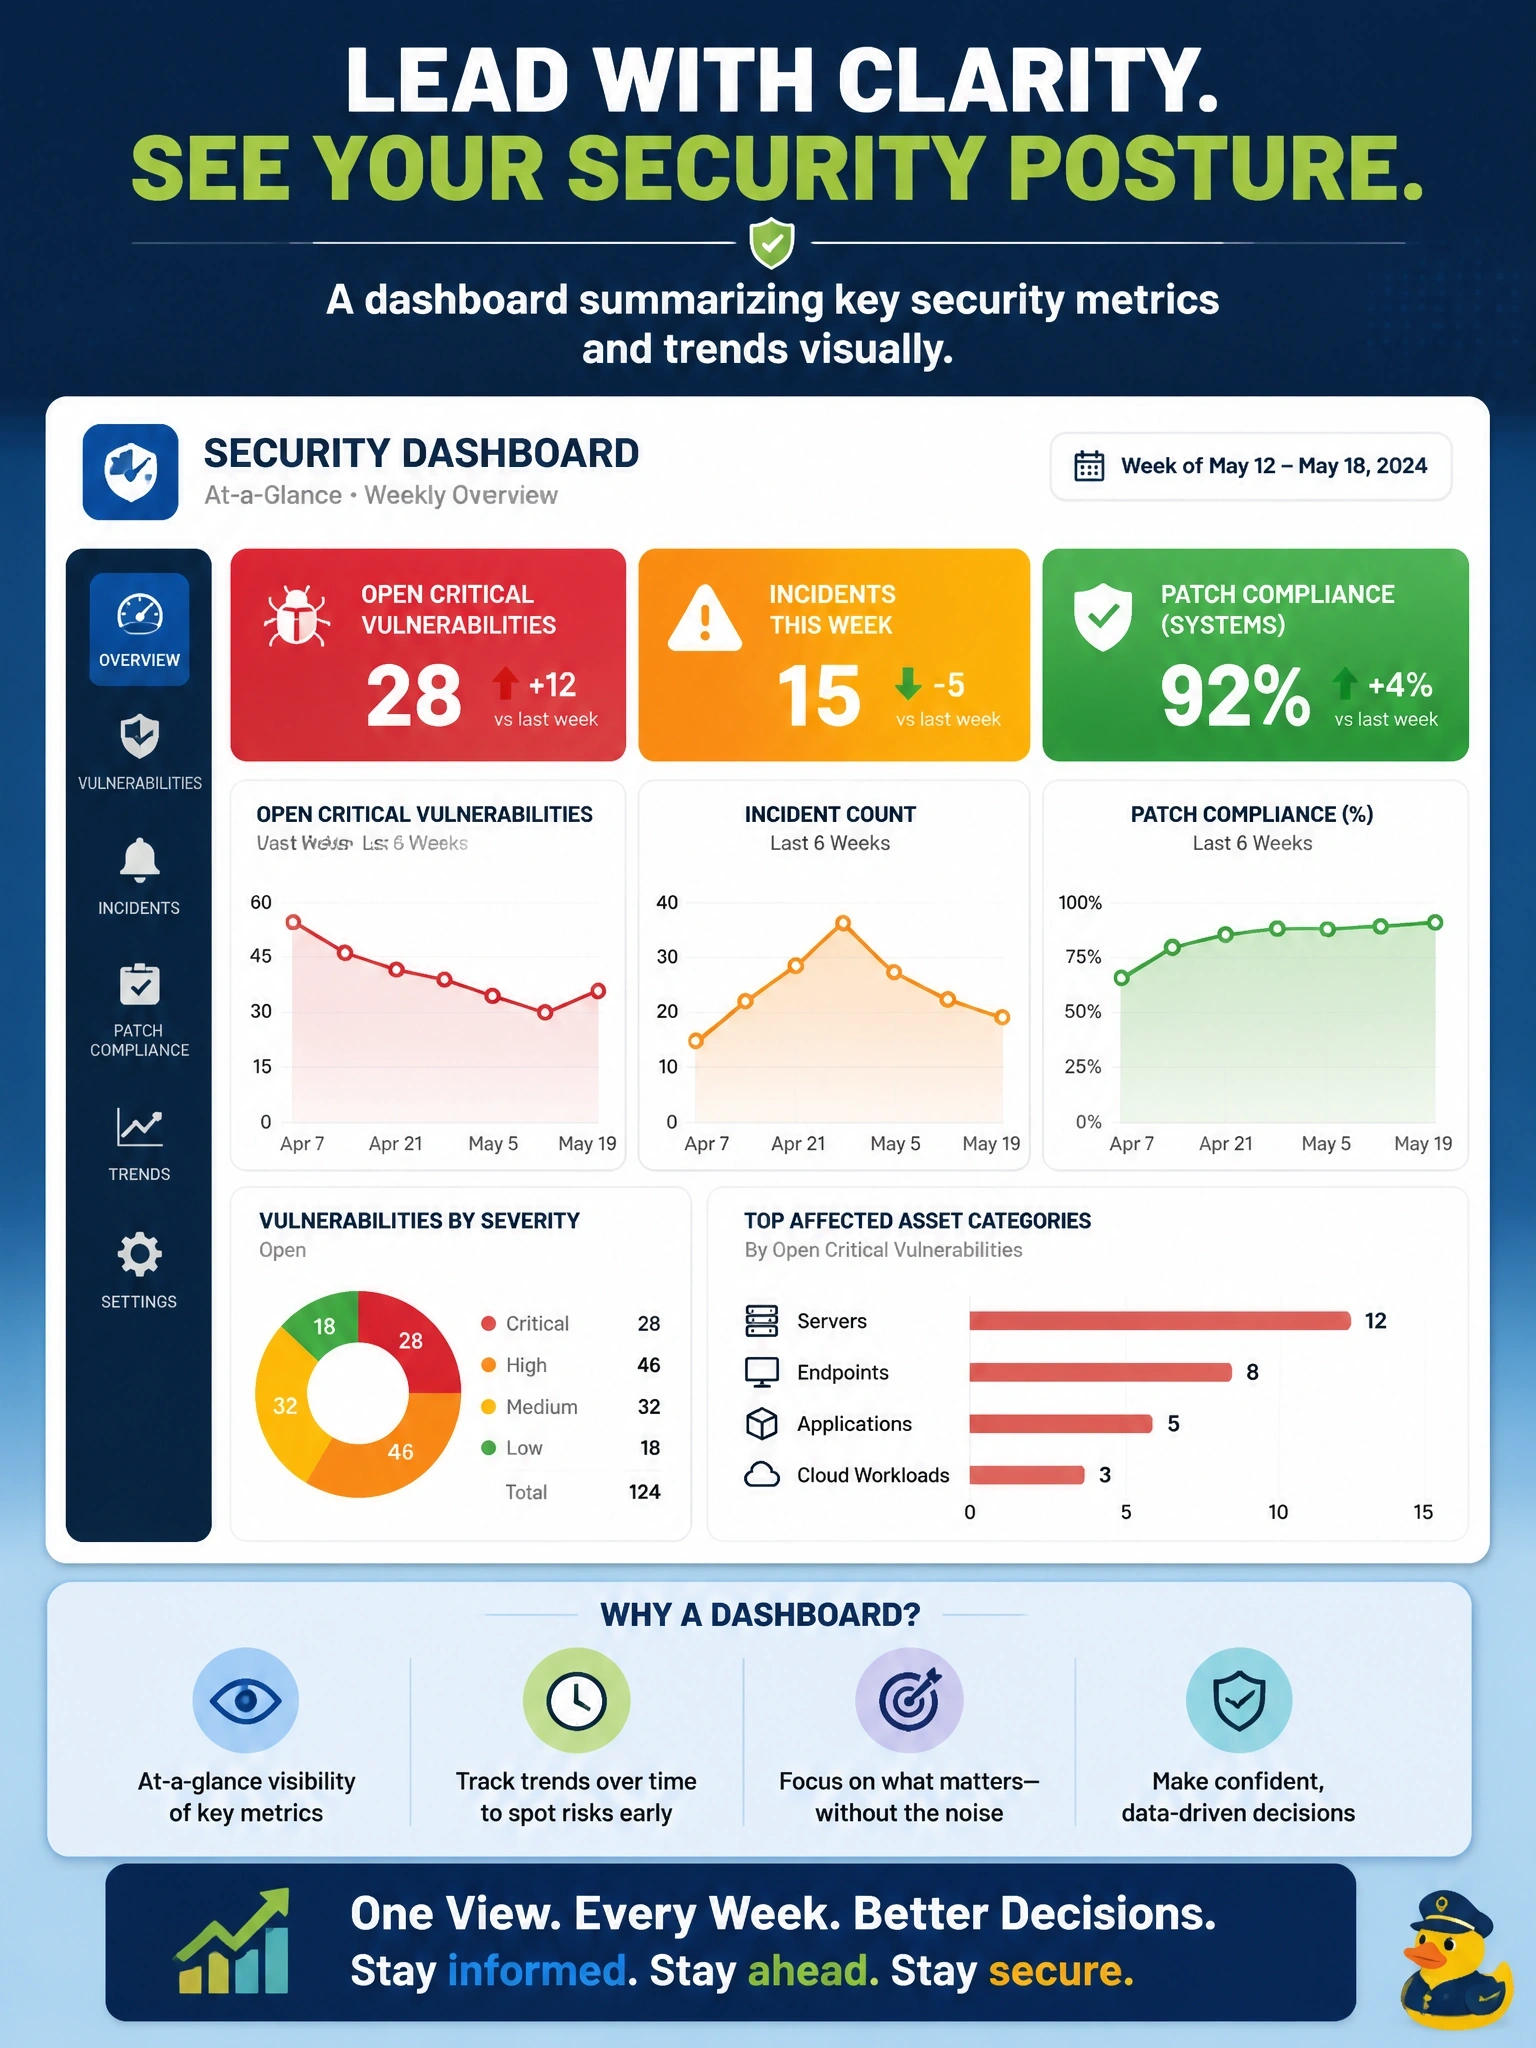
Your executives want the car's dashboard, not the mechanic's diagnostic printout. A dashboard rolls everything up into trends they can read in thirty seconds. Paging them for every alert is the trap - that's for responders, not the boardroom.
Full Explanation
Dashboards present aggregated metrics visually: counts, trends, percentages, and status indicators drawn from monitoring and management systems. For leadership, a well-designed dashboard shows posture over time, such as open critical vulnerabilities, incident volume, mean time to remediate, and patch compliance, so decisions can be made without reading individual events. It satisfies the request for an at-a-glance weekly view without interruptions. Automated alerts are designed to notify responders when a specific condition requires action; routing them to executives produces constant interruptions and no sense of overall trend, which is the opposite of the requirement. Raw syslog feeds are unprocessed event streams useful to analysts and log platforms, but they are unreadable as a posture summary and would flood executive mailboxes. A packet analyzer console shows individual frames and protocol details, a deep troubleshooting tool that conveys nothing about organizational posture. Exam caveat: alerts and dashboards complement each other; alerts drive response, and dashboards drive oversight and accountability. Operational check: confirm each dashboard metric has a defined data source and refresh schedule, and review it with leadership to ensure every displayed figure maps to a decision or owner.