
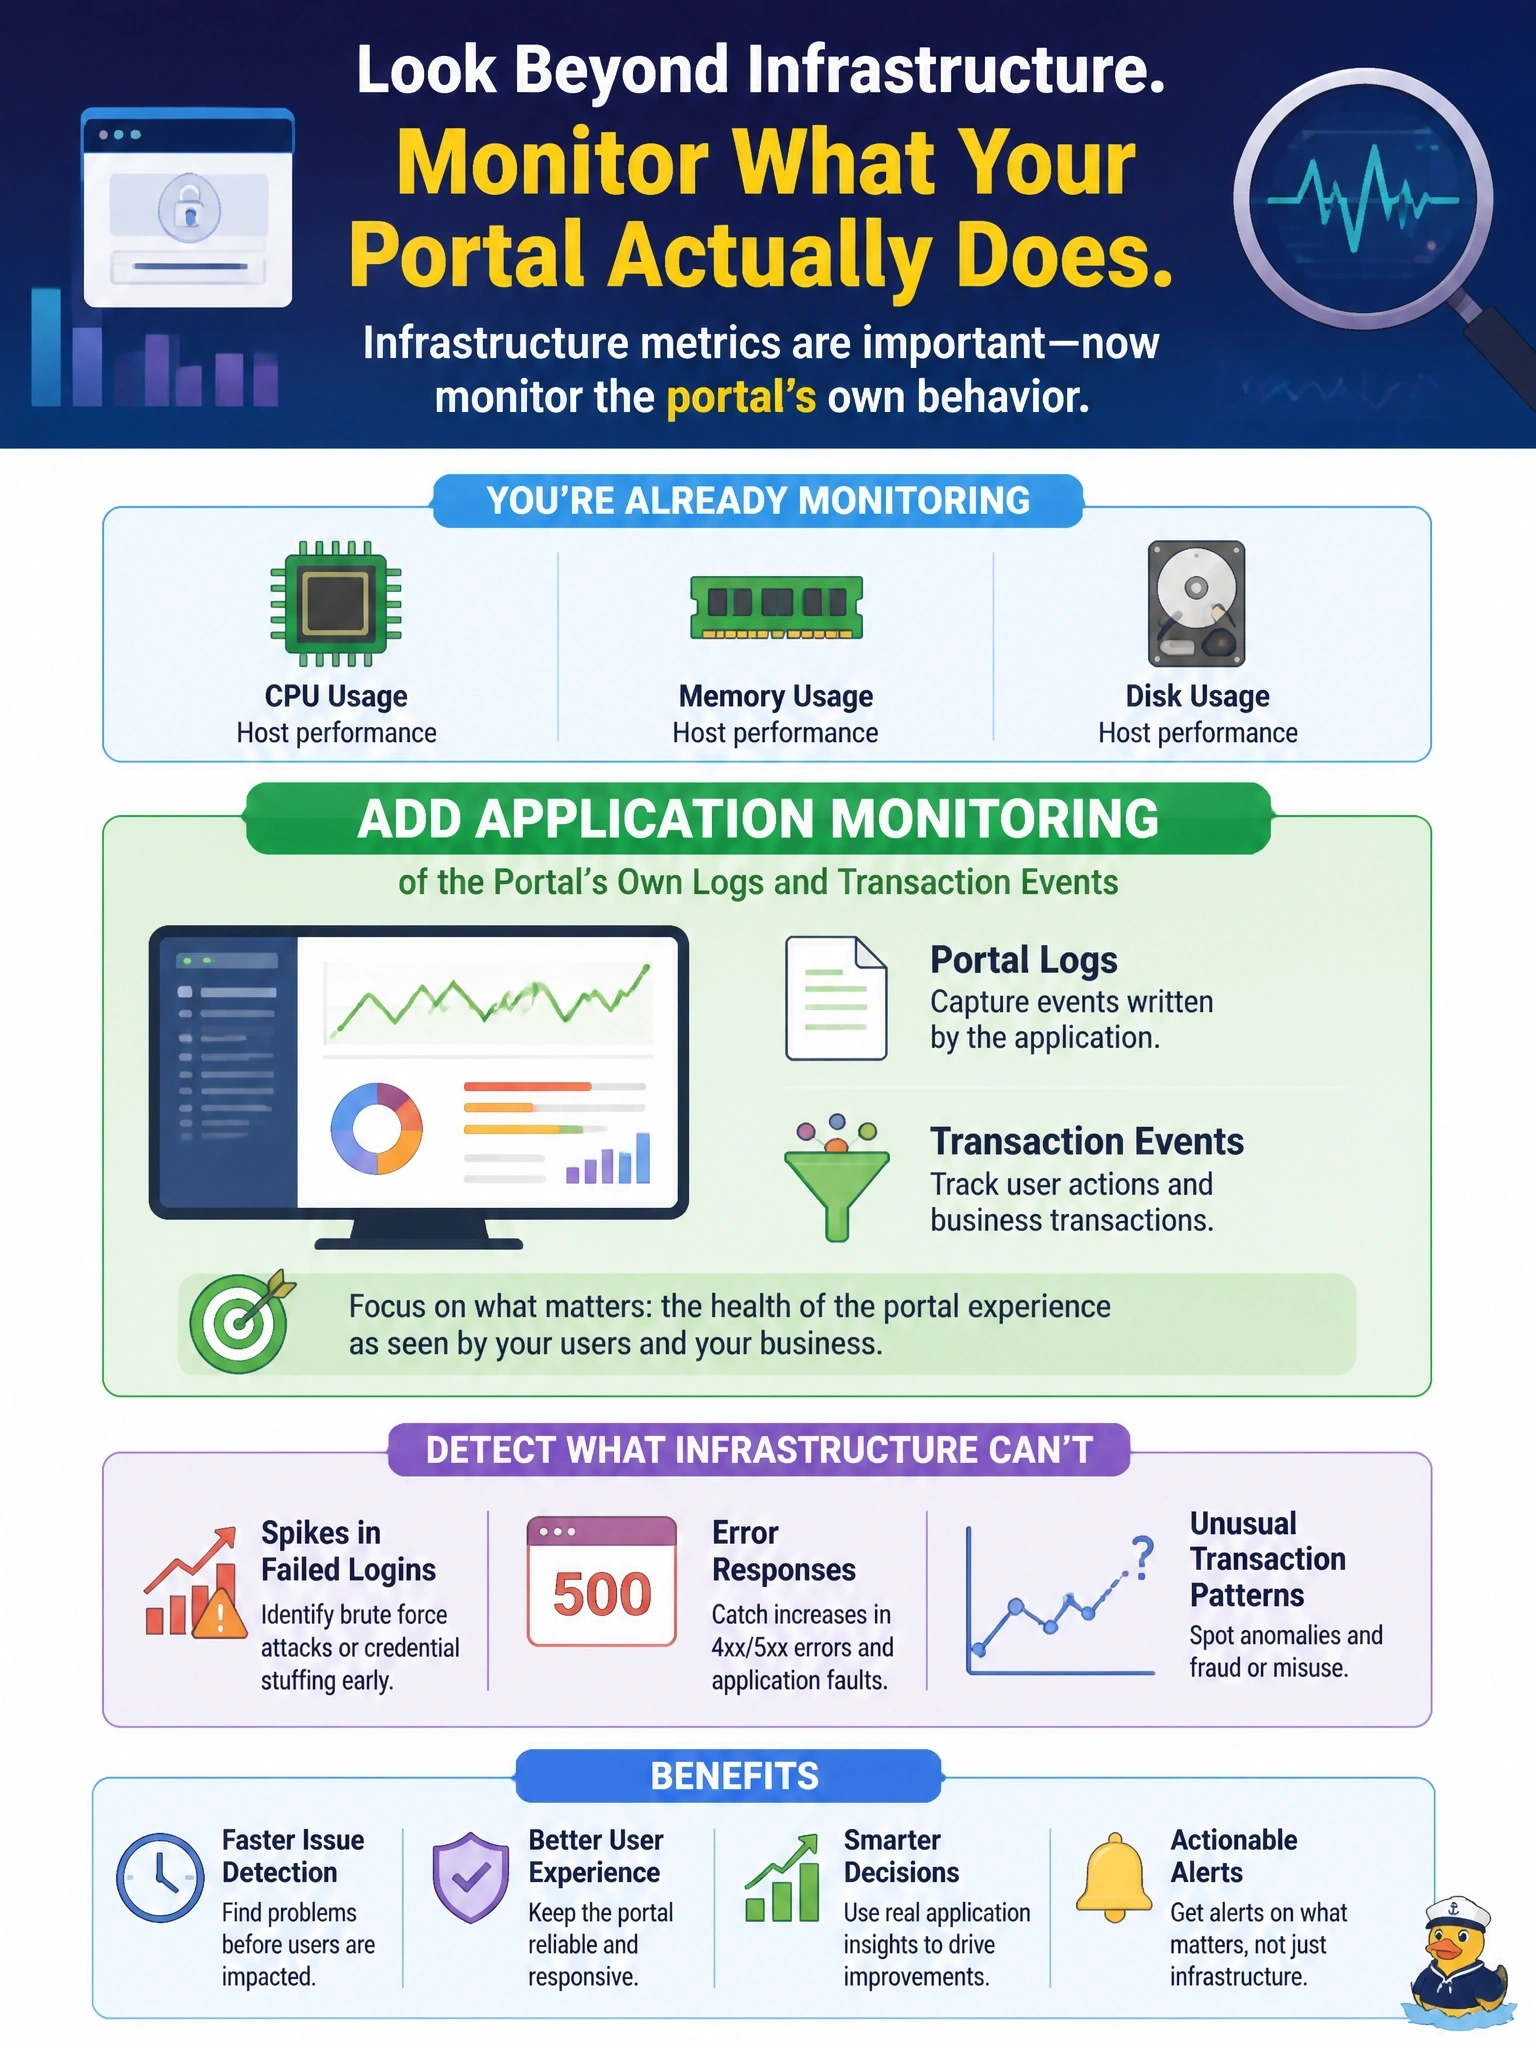
A team already monitors CPU, memory, and disk usage on the hosts that run a customer portal. They now need to detect spikes in failed logins, error responses, and unusual transaction patterns produced by the portal itself. Which category of monitoring should they add?
Select an answer to reveal the explanation.
Short Explanation
Your hosts can look perfectly healthy while the app on top is getting hammered with bad logins. Host counters are the car's engine gauges; application monitoring is listening to what the passengers are saying. The trap is adding more system counters you already have.
Full Explanation
Monitoring computing resources spans systems, applications, and infrastructure, and each layer produces different telemetry. Application monitoring collects events generated by the software itself: authentication successes and failures, error codes, transaction volumes and types, and business-level anomalies. Those are exactly the signals needed to spot credential attacks or abuse against the portal, and they are invisible to host counters because a brute-force attack may barely move CPU or memory. Systems monitoring of processor, memory, and storage is what the team already has; adding more of it does not reveal login failures or abnormal transactions. Infrastructure monitoring of switches and routers shows link utilization and device health, useful for capacity and network faults, but it does not see application-layer outcomes such as which logins failed. Physical and environmental monitoring of power and cooling protects facilities, not application behavior. Exam caveat: complete coverage normally combines all three layers, and correlation in a SIEM is where they meet. Operational check: confirm the portal writes structured authentication and error events, forward them to the central log platform, and test an alert by generating a burst of failed logins in a test environment.