
A switch model a warehouse plans to buy averages a long time between failures. Which figure states that property?
Select an answer to reveal the explanation.
Short Explanation
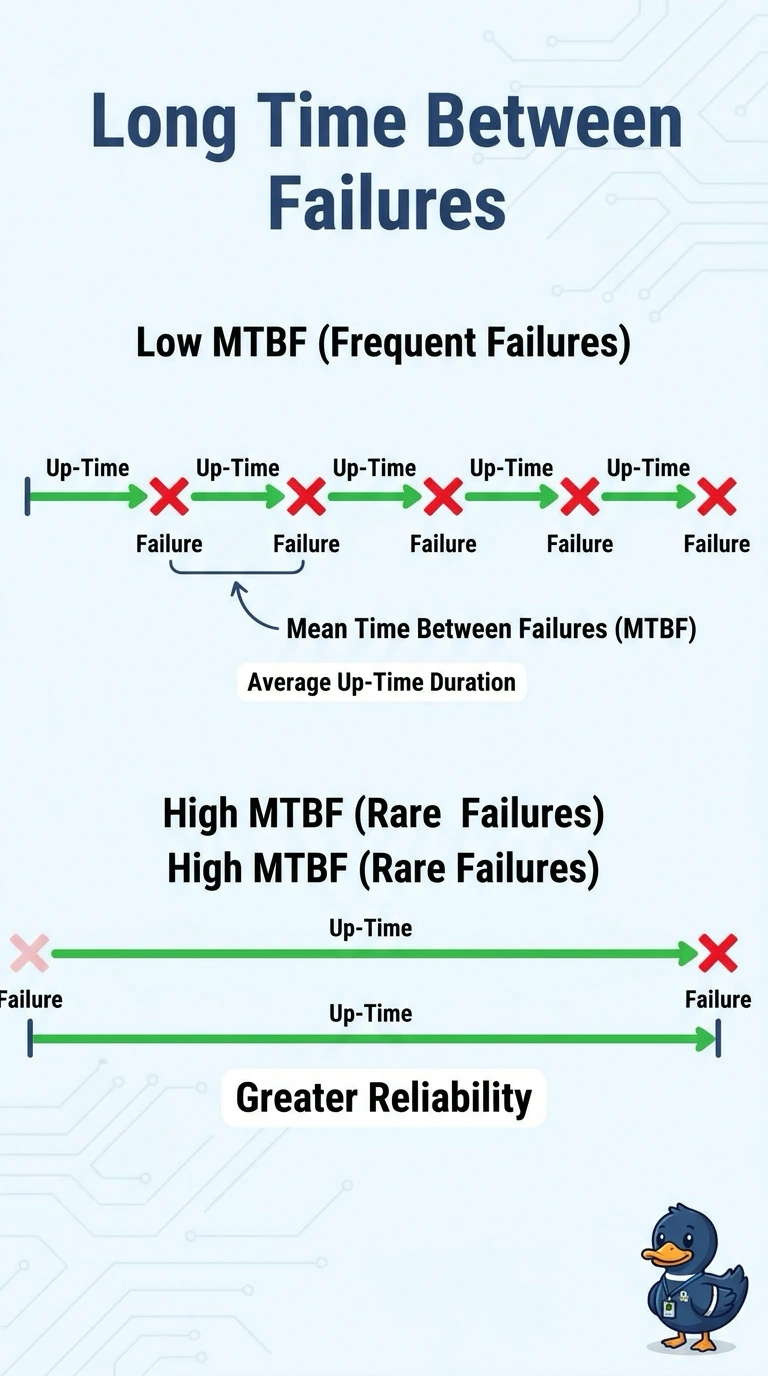
Mean time between failures is the average stretch of honest work between breakdowns. You want that number high when a switch model tends to run a long time before it fails. A low number means the opposite, and a fast repair is a different average from a rare failure.
Full Explanation
Mean time between failures is the average operating time between one failure and the next. A switch that averages a long time between failures is described by a high mean time between failures. A low figure is the reversed reading. People treat a small number as a long gap, and a small mean time between failures means the model fails more often. Mean time to repair is the average time required to restore service after a failure. A low repair time means the outage is short once it starts. It says nothing about how often the outage starts, so describing a fast repair as rarity of failure swaps the two averages. A recovery point objective is how much data, measured in time, the business can afford to lose. It is not a hardware reliability statistic. Exam caveat: a high mean time between failures does not promise that this particular unit will last that long. Operational check: read the model's figure on the data sheet, confirm it is mean time between failures rather than mean time to repair, and keep the repair-time target on a separate line.