
A Python service built with SQLAlchemy has slow endpoints, and the DBA needs to see the exact SQL statements the ORM sends to the database before tuning anything. What is the most direct first step?
Select an answer to reveal the explanation.
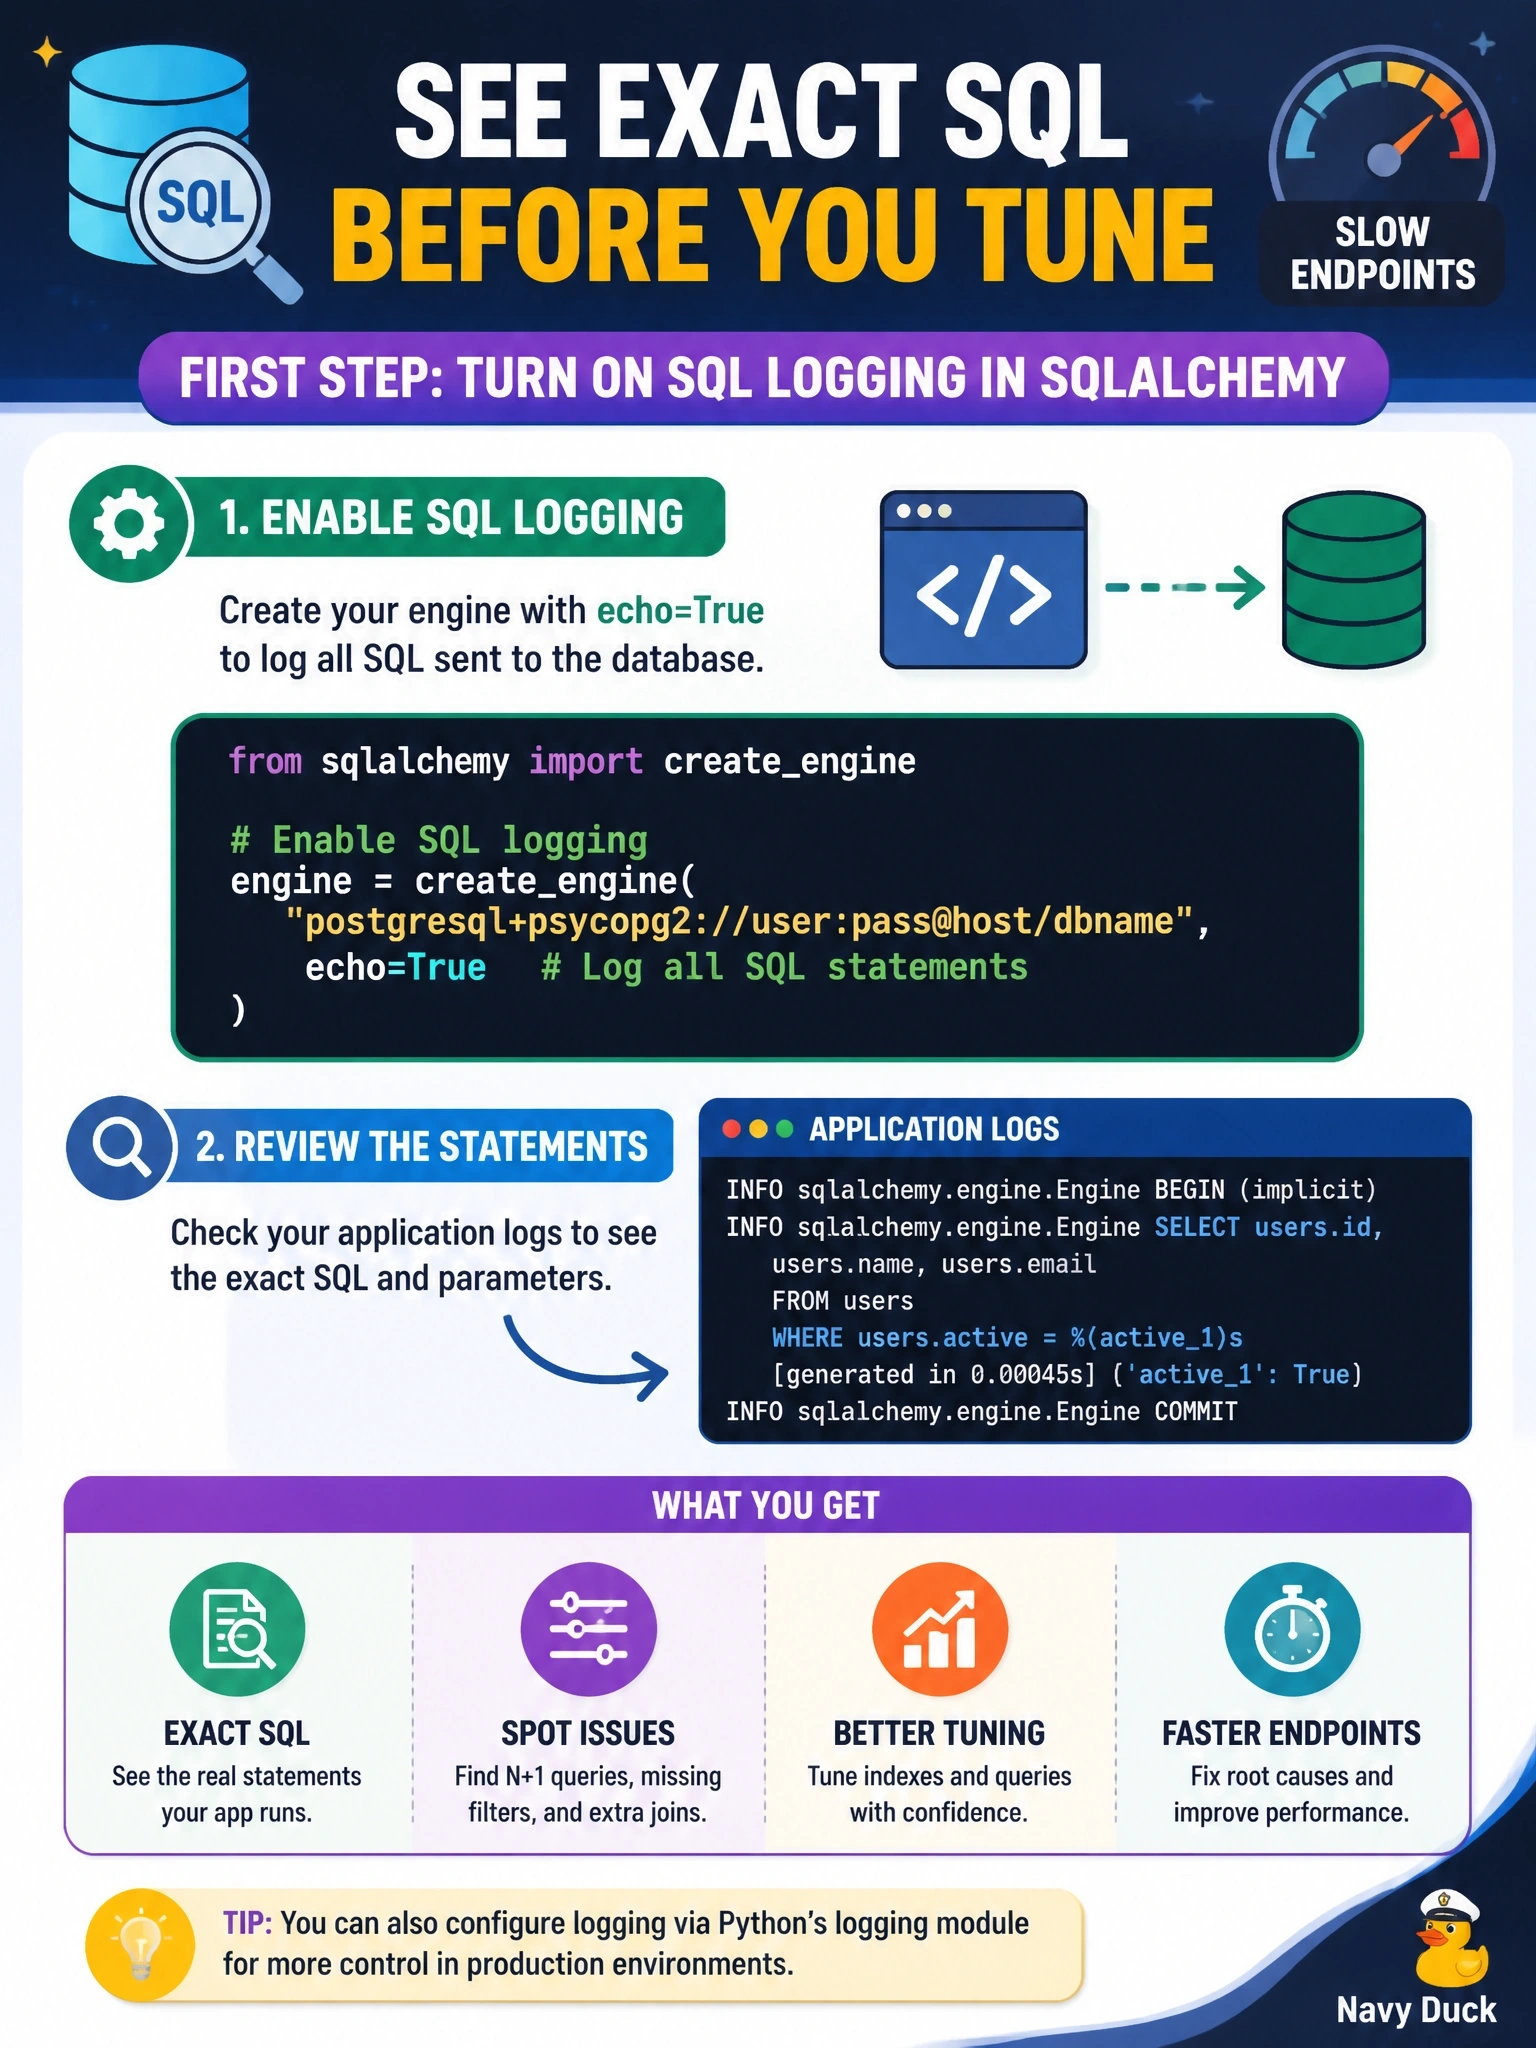
Short Explanation
You can't tune what you can't see. Turn on the ORM's SQL logging first so you're looking at the real queries, not your guess about them. The trap is jumping straight to fixes, like indexing everything, before you know what's actually slow.
Full Explanation
Measuring the impact of ORM code starts with reviewing the SQL the ORM actually generates. SQLAlchemy can log every statement it emits, along with bound parameters, either by passing echo=True when creating the engine or by raising the level of its engine logger through Python's standard logging module. With that output, the DBA can see repeated queries, unexpected joins, missing filters or N+1 patterns, then capture specific statements to examine their execution plans. That evidence drives the next steps: confirm the code is valid, determine its impact on the database server and remediate. Rewriting every ORM call as raw SQL before measuring is a large, risky change made without knowing which statements are slow, and it may discard working code for no benefit. Indexing every referenced column slows writes, consumes storage and may not address the real problem, which could be the number of queries rather than their plans. Enlarging the connection pool lets more statements run concurrently but does not make any individual query faster and can increase contention on the server. Exam caveat: verbose SQL logging produces a lot of output and may record sensitive parameter values, so it should be enabled temporarily or in a non-production environment. Operational check: enable logging, call one slow endpoint, count the statements it produces, and run the slowest statement's execution plan to identify the specific issue.