
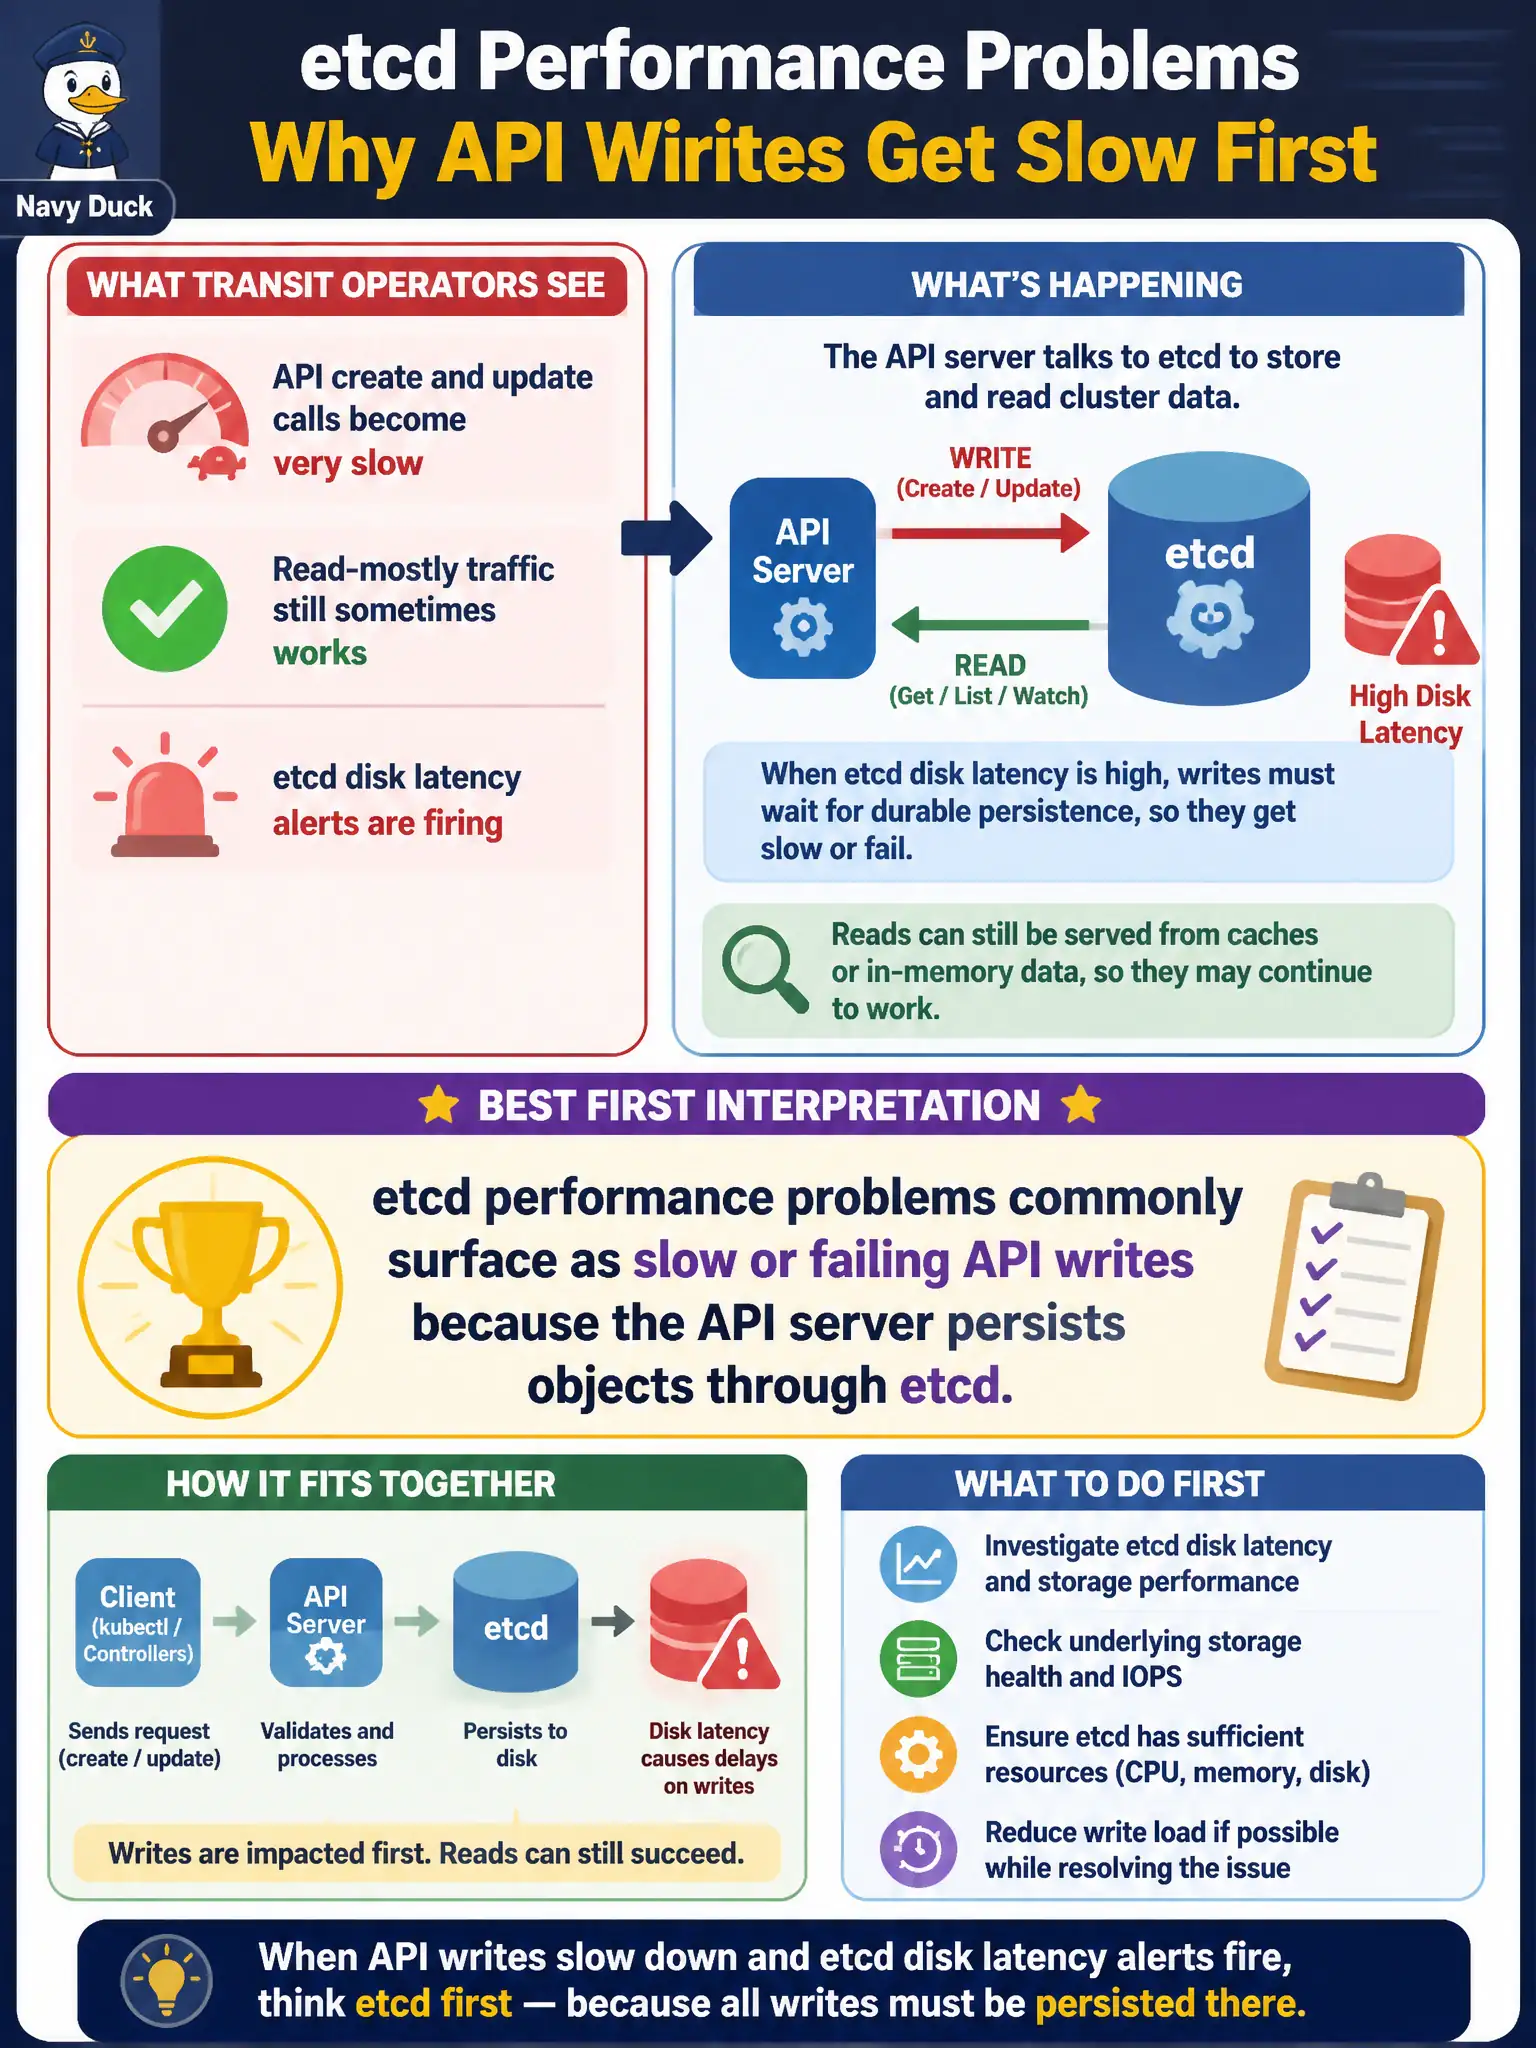
Transit operators see API create and update calls become very slow while read-mostly traffic still sometimes works. etcd disk latency alerts are firing. What is the best first interpretation?
Select an answer to reveal the explanation.
Short Explanation
The API server stores the cluster's notebook in etcd—if that notebook's disk crawls, writing new pages feels stuck even when some reads still limp along. Fix etcd health and latency first.
Full Explanation
The API server persists nearly every mutating API call through etcd. When etcd’s disk latency spikes, puts and transactions stall, so create/update calls feel very slow while some read paths may still limp along from cache or lighter load. Municipal operators seeing slow writes plus etcd disk alerts should interpret etcd performance as the primary suspect first. Flushing kube-proxy iptables rules does not cure etcd disk latency and is not what “always” explains slow API writes—proxy issues affect Service packet paths, not etcd fsync time. Disk latency in etcd absolutely can affect object creates and updates; claiming it only affects kubectl top is false and confuses metrics with the datastore. CNI VXLAN MTU mismatches cause large-packet loss between pods; they do not uniquely generate etcd write latency alerts on the control-plane disks. Exam caveat: Distinguish API slowness from CNI timeouts and from apiserver CPU saturation; etcd alerts plus write-heavy symptoms are the linkage CKA expects you to make quickly. Operational check: Check etcd metrics (wal fsync duration, backend commit), disk utilization on control-plane volumes, slow query/log messages; move etcd to faster disks if needed, ensure not filling the volume, and validate that civic create/update latency recovers as etcd latency drops.