
A logistics company wants one place to correlate interface errors, congestion, and anomalies across a Nexus fabric instead of opening SSH to every switch. Which product family is built for that fabric-wide view?
Select an answer to reveal the explanation.
Short Explanation
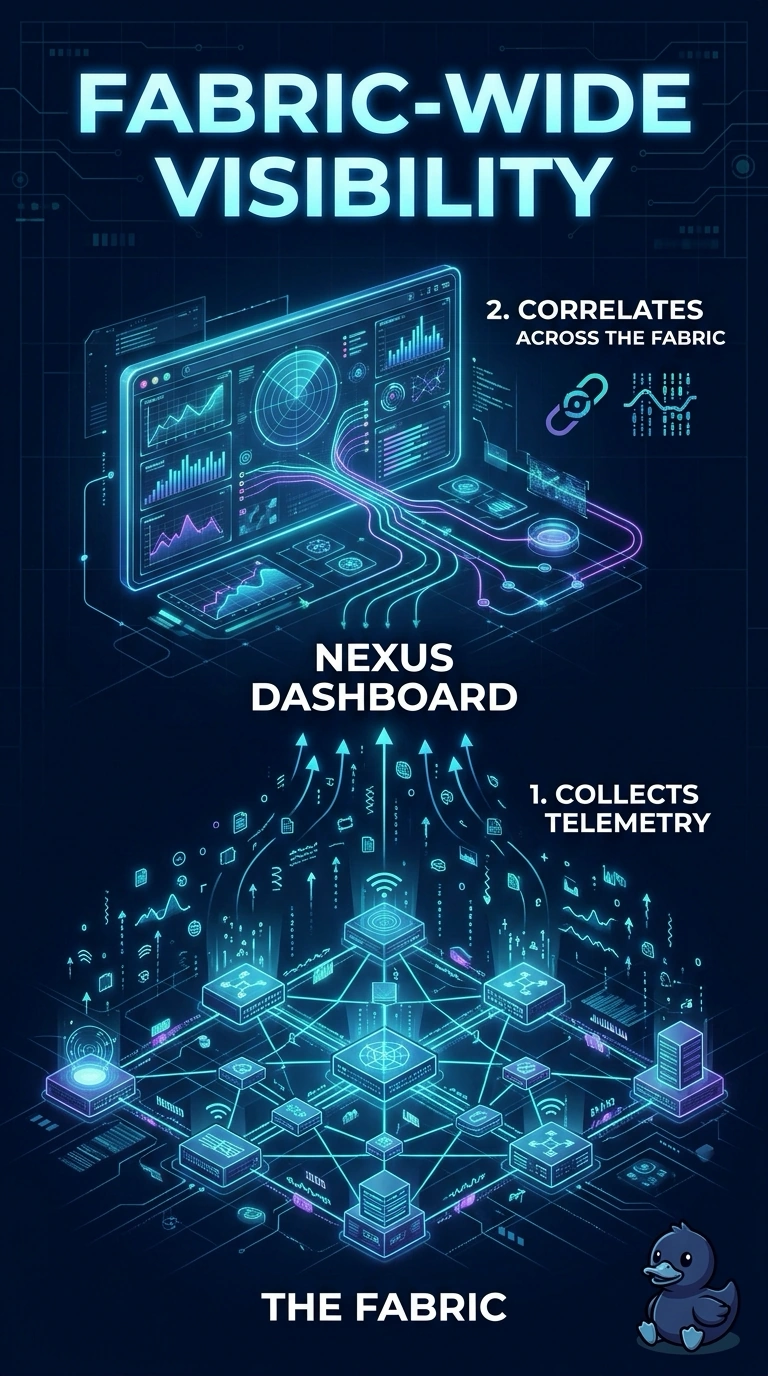
You want a control tower, not another walk to each switch. Nexus Dashboard is where this fabric's telemetry can be collected and correlated. A laptop on a SPAN port sees packets, and it does not become the history of the whole logistics fabric.
Full Explanation
Nexus Dashboard is the Cisco platform that hosts fabric visibility and assurance. It collects telemetry from the switches and correlates events such as errors and congestion across the fabric, which is the single view the logistics team is asking for. POAP bootstraps a switch that has no startup configuration. It does not correlate production anomalies on later boots. A SPAN session copies frames from selected ports to an analyzer. A laptop on that session does not retain a fabric-wide anomaly history and does not poll every switch. The onboard scheduler runs commands on the switch where it is configured. It does not summarize switches it does not run on. Caveat: the switches still need a supported telemetry or streaming path into the dashboard, or the product is installed and the views stay empty. Operational check: confirm the fabric switches are registered to Nexus Dashboard and that a known test error on one leaf shows up in the correlated view without an SSH session to that leaf. Record the before and after values in the change ticket so the next shift can see what changed.