
A tuned intrusion policy should block a specific exploit, yet sessions continue and the event views show nothing for that traffic. Engineers must see how Snort judged each packet individually, including packets that raised no event, and they must get that answer without opening a Cisco support case. Which troubleshooting tool prints the per-packet Snort verdicts?
Select an answer to reveal the explanation.
Short Explanation
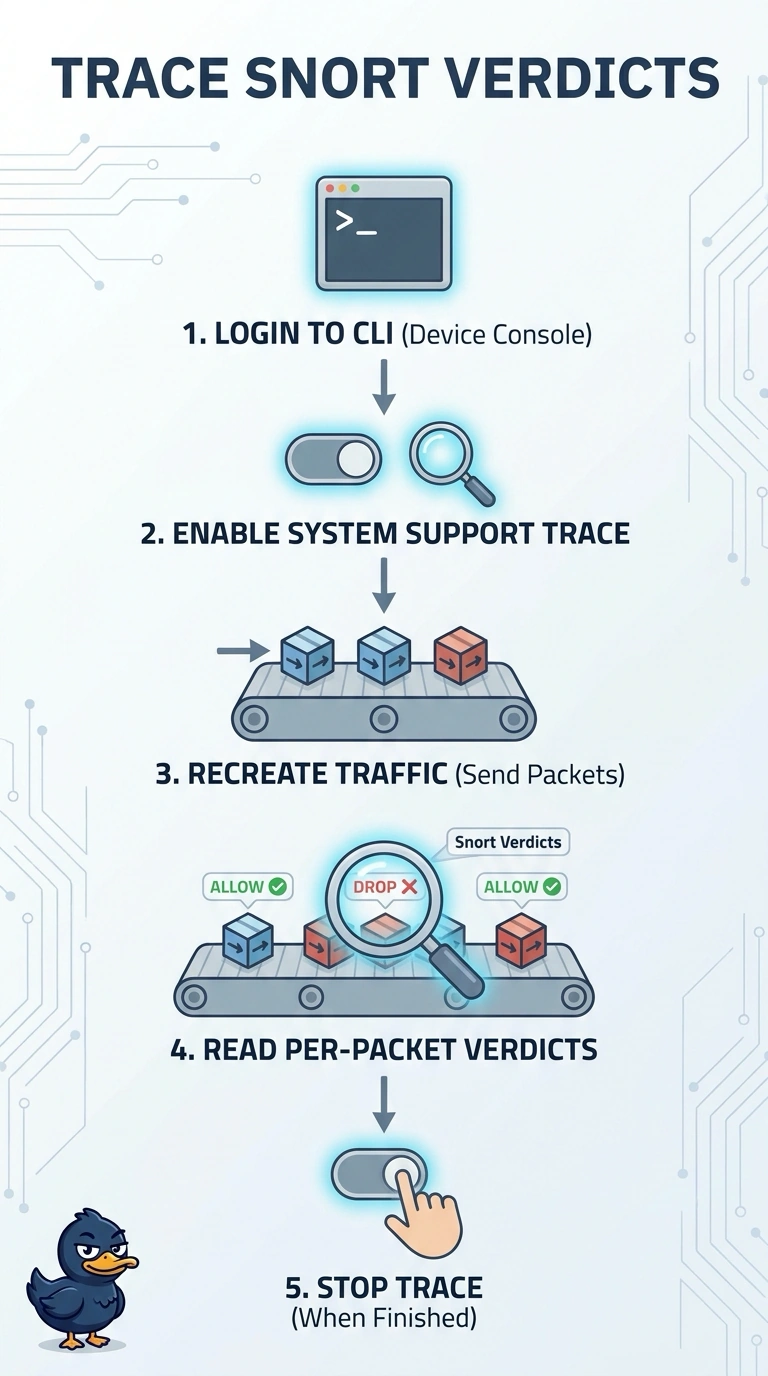
Enable the system support trace on the Threat Defense CLI to get a play-by-play of how Snort judged each packet, including packets that raised no event. It’s the per-packet view you need to explain why traffic passed even when the event logs are empty.
Full Explanation
The system support trace reports how the inspection engine treated packets selected for tracing, which is exactly what you need when a rule should have fired and nothing appeared anywhere. It can show decisions for traced packets, including packets that generate no event, so you can tell whether Snort saw a packet and whether it allowed or dropped it. Connection events summarize a flow after the fact and stay silent whenever nothing was logged, so they cannot explain a pass. A real-time packet capture proves the packets reach and leave the appliance, but a capture only shows bytes on the wire and says nothing about the engine's reasoning. Collecting a technical support bundle for Cisco TAC may eventually surface the answer, but it is an escalation path rather than a self-service diagnosis. Exam caveat: the trace is verbose and short-lived, so enable it just before reproducing the traffic. Practical check: start the trace, replay the exploit packets, read the verdict lines, then turn it off.