
A hospital's inline Secure Firewall Threat Defense appliance appears to drop packets on an HL7 interface. Connection events log the flow as allowed and the intrusion events table stays empty for it. The engineer needs Snort's pass-or-drop verdict for each individual packet on the wire. Which troubleshooting tool shows those per-packet verdicts?
Select an answer to reveal the explanation.
Short Explanation
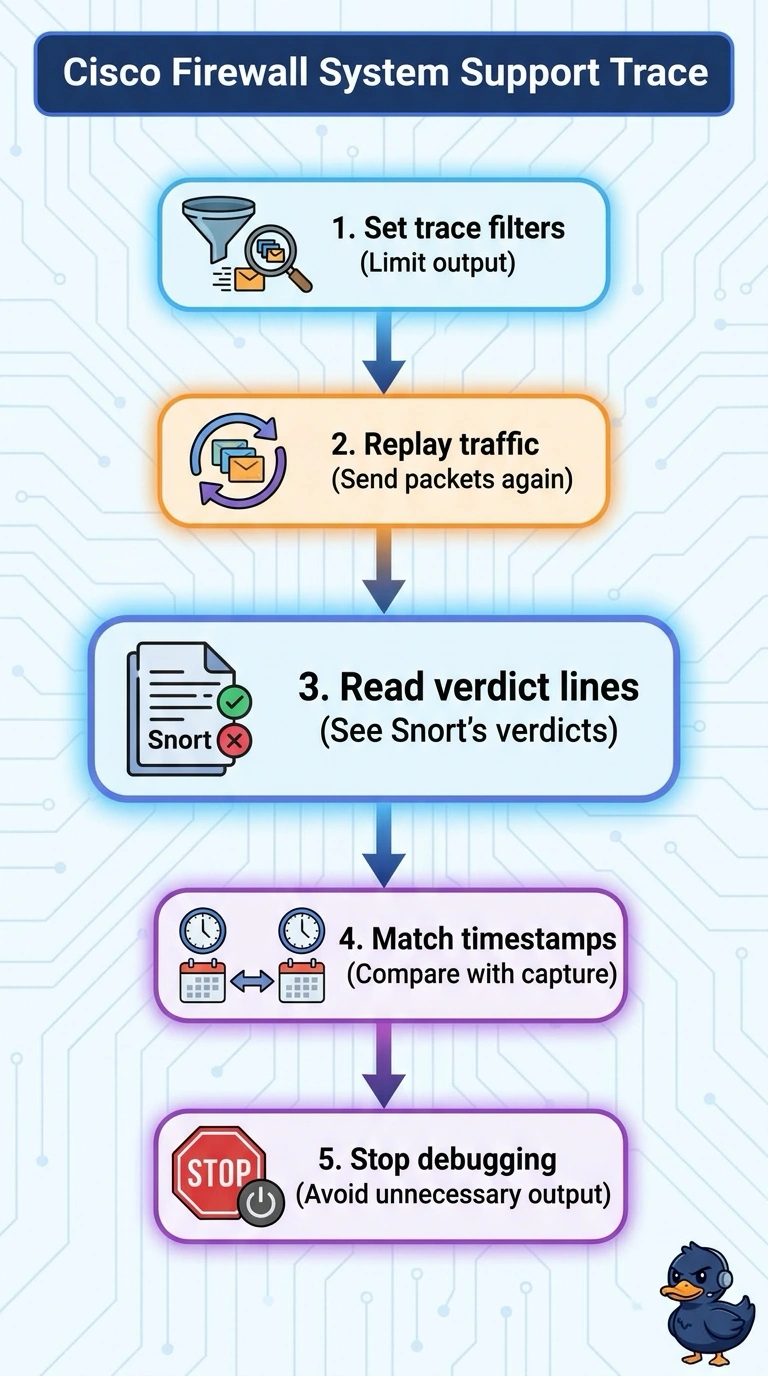
Connection events and the intrusion events table do not show a verdict for every packet, so you need a packet-level view. Use the system support trace while you reproduce the traffic to see Snort’s pass-or-drop verdict for each packet. Think of it as a play-by-play rather than a final score.
Full Explanation
The system support trace tool on the Threat Defense CLI shows Snort’s real-time inspection of a flow and reports a verdict, such as PASS or drop, for each packet, along with the policy IDs involved. This packet-level view helps you investigate why a connection event is marked allowed even though packets may not reach the far side. The intrusion events table records intrusion events, not every packet Snort passes or drops, so an empty table does not establish that all packets passed. A tcpdump capture on the data interface shows packets observed there, but does not report Snort’s verdict for each packet. Expanding a flow on the connection events page provides connection-level information, not a verdict for every individual packet. Exam caveat: an allowed connection event and an empty intrusion events table do not rule out packet drops; the trace is the tool that provides the requested per-packet verdicts. Practical check: reproduce the traffic while collecting the trace, apply filters to keep the output manageable, limit the troubleshooting window, and compare trace timestamps with capture timestamps.