
A web app behind an FTD times out for a few users while the FMC connection event table stays empty for its server, so the engineer needs supported evidence that real packets are reaching the inspection engine on the inside interface. Which Threat Defense method shows those packets where inspection happens?
Select an answer to reveal the explanation.
Short Explanation
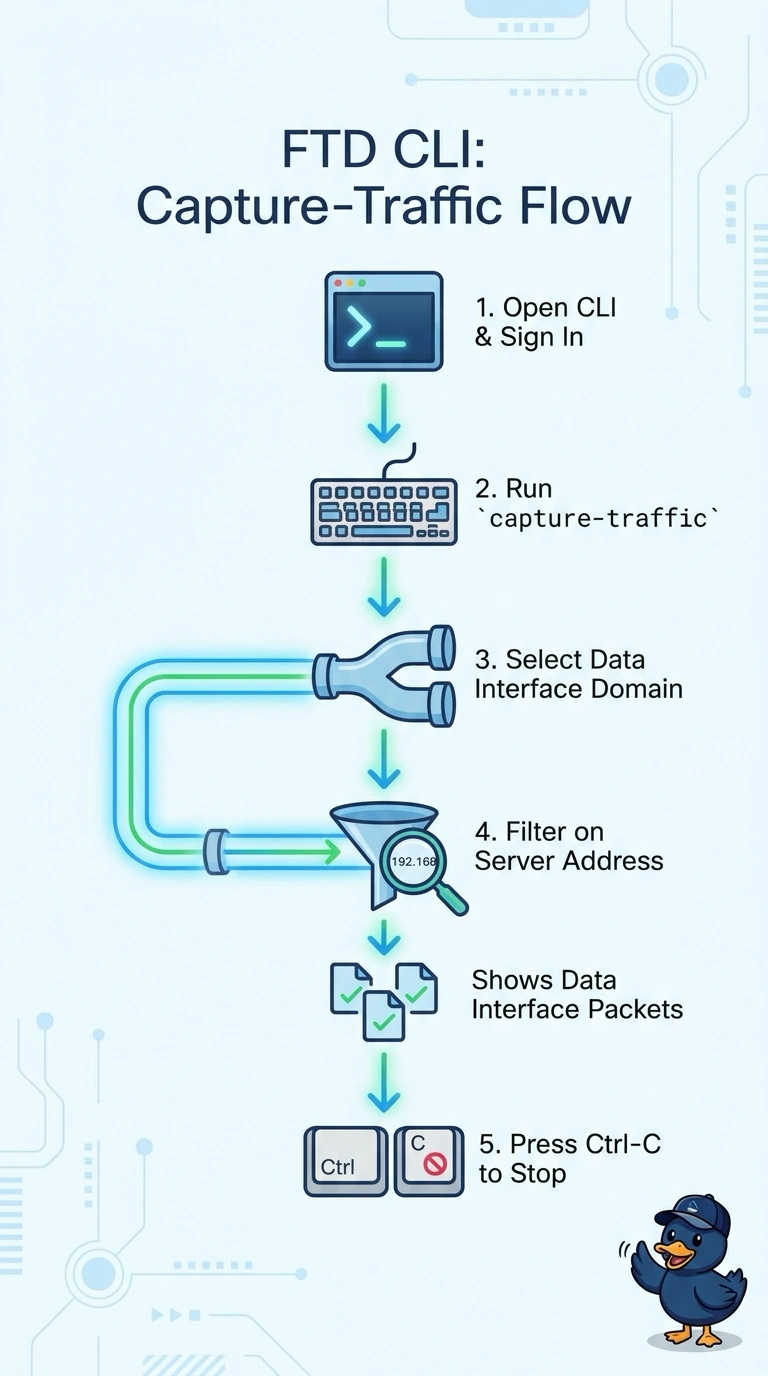
When the FMC event table is empty, you can use the regular FTD CLI capture-traffic command, filtered for the server address, to see packets in the data-interface domain where inspection happens. It’s like checking the loading dock directly instead of guessing from the shipping manifest.
Full Explanation
The regular Threat Defense CLI provides the capture-traffic command for capturing traffic on a data interface domain. You can use tcpdump-style filters, such as a host filter for the server, to display packets as they reach the inspection engine and determine whether traffic arrives there. The expert-mode route does not meet the supported-method requirement: Cisco says expert mode is unsupported unless a documented procedure or the Technical Assistance Center directs its use. An interface capture is supported, but it captures at the LINA engine rather than at the Snort inspection point, so it does not show whether Snort received the flow. Packet tracer models a flow against policy rather than showing live packets. The capture-traffic command offers management and data domains, so selecting the wrong one will not show user traffic. Start capture-traffic with a host filter, reproduce the timeout, and compare the capture with the connection event table.