
During a branch outage, an engineer must show the current tunnel state for one edge router on a wall display that refreshes every five seconds. Next week a separate report must summarize bandwidth for that same router across seven days. Which monitoring request should drive the live tunnel view?
Select an answer to reveal the explanation.
Short Explanation
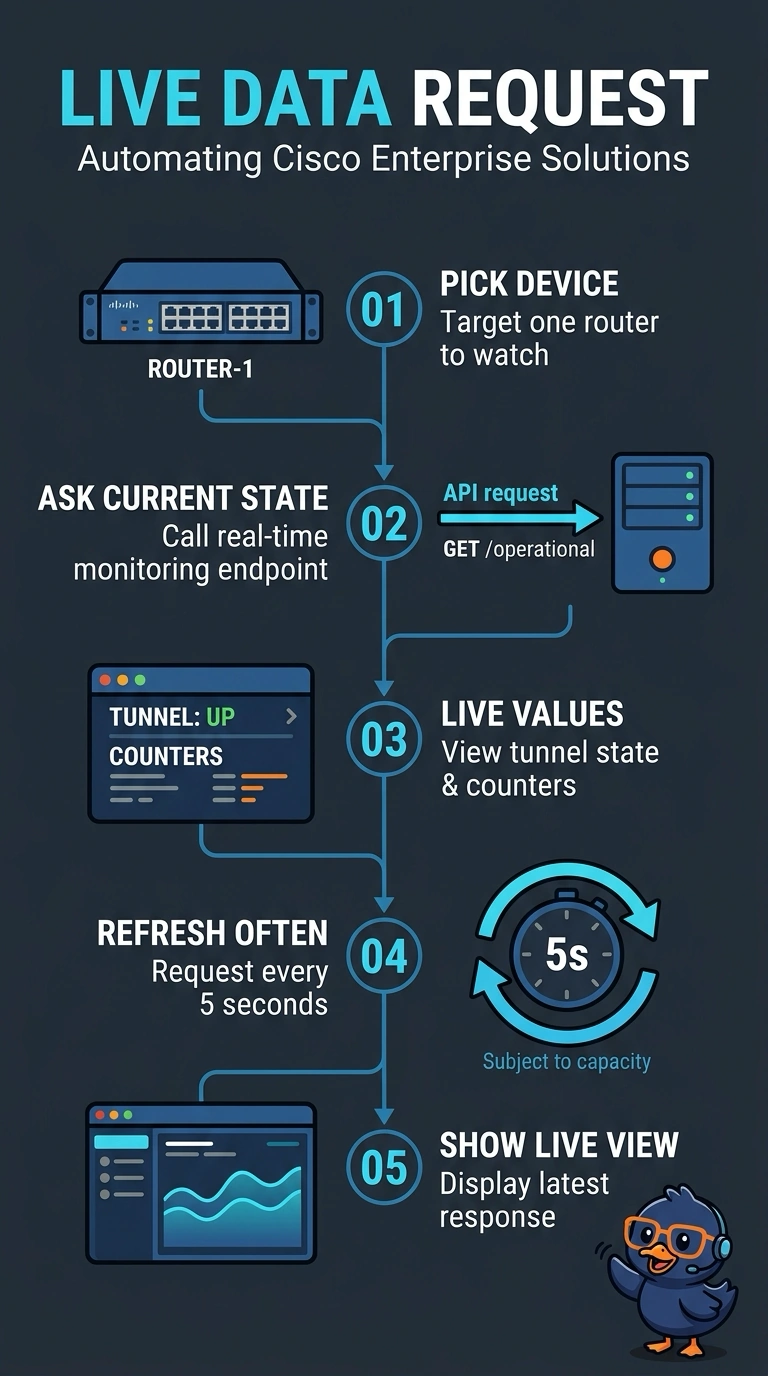
The real-time monitoring endpoint provides current device state, so you can request it again for each refresh, subject to platform and API capacity. It's like glancing at a gauge instead of reading a logbook. Historical data is collected over time and is better suited to trends than a live view.
Full Explanation
SD-WAN Manager, formerly vManage, separates monitoring into two families, and your choice follows the time dimension of the question. A real-time monitoring request asks about one device or one tunnel at the present time and returns current values such as state and counters. It can be repeated for a live display, subject to platform and API capacity. A historical statistics request takes a start time, an end time and an aggregation interval, then returns stored samples built for trends and averages over days. Pulling the newest sample out of a historical window looks tempting, but that sample may not reflect the live state, and the query is designed for a time range. Reading the running configuration confuses intent with operation, because the config shows how the tunnel was commanded rather than whether it is up. Leaning on an inventory reachability flag confuses router reachability with tunnel health, so a dead tunnel behind a reachable router may go unnoticed. Endpoint paths and payload fields can vary between releases, so use the documentation for the deployed release rather than assuming a specific string.