
A service provider NOC builds a daily Python report for 60 SD-WAN edge routers. It needs per-interface throughput counters, CPU and memory trends, and every unresolved alarm from the past 24 hours at each site, and a separate script already lists the routers with their software releases. Which SD-WAN Manager API family should the script call to collect the counters, trends, and open alarms?
Select an answer to reveal the explanation.
Short Explanation
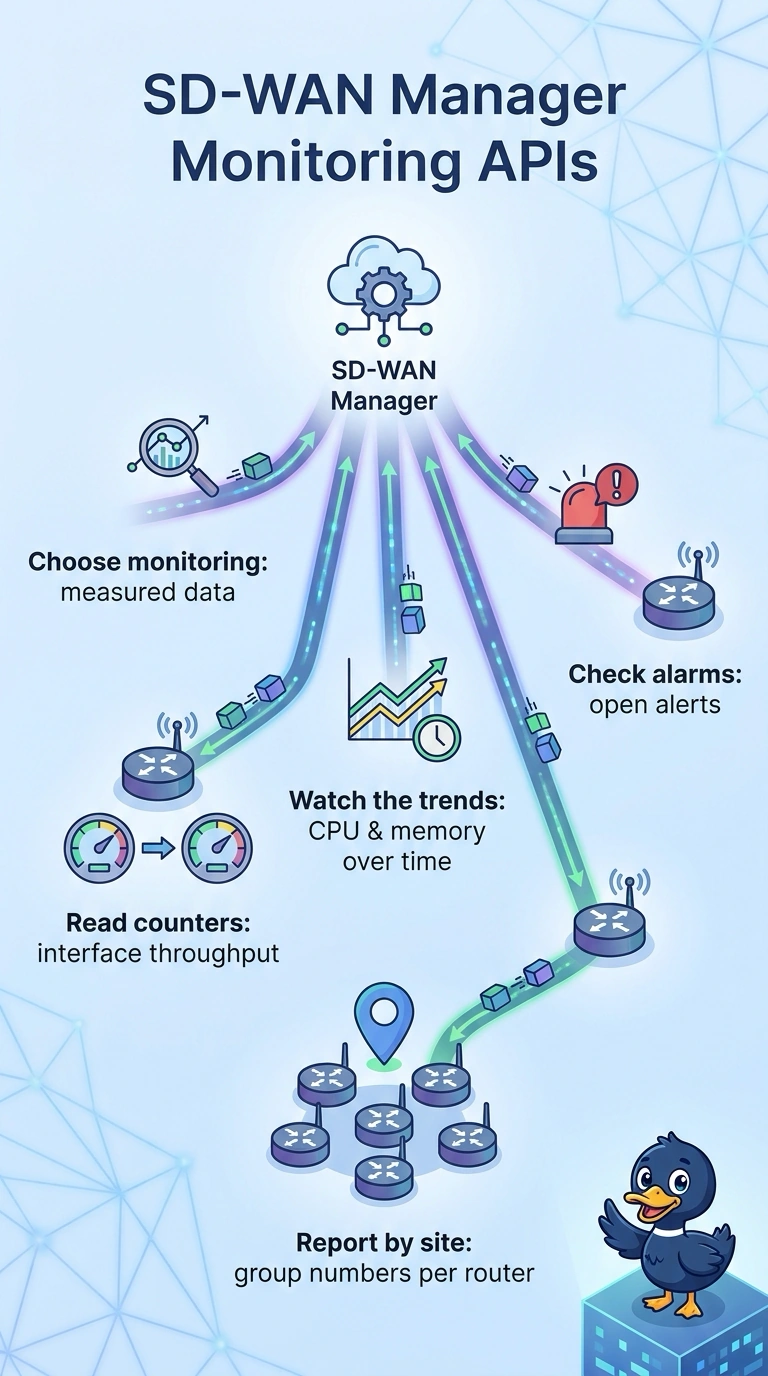
You need interface counters, resource trends, and unresolved alarms together, so the monitoring APIs are the right fit for your report. They cover the full set of data you need across the routers.
Full Explanation
The monitoring APIs are the best fit because your report combines operational performance data with alarm state: per-interface throughput counters, CPU and memory trends, and unresolved alarms across a defined 24-hour window. This family is designed to expose router monitoring views together, so it covers the requested data; the separate script that lists software releases does not change that choice. Statistics APIs can provide interface counters and resource history, but they are centered on measurements rather than a complete inventory of unresolved alarms. Keeping alarm review separate would leave your report without the required alarms at each site. Health APIs can provide CPU and memory trends and site alarm information, but aggregate interface health is not a substitute for counters broken out by interface, so the throughput requirement would remain unmet. Streaming telemetry is a common choice for high-volume interface and device measurements, but a notification feed is not necessarily a queryable inventory of every alarm still unresolved from the preceding 24 hours. An exam caveat is that API-family names and response coverage can vary by SD-WAN Manager release, and related data may be exposed through separate endpoints even when the conceptual family is monitoring. As a practical check, consult the version-matched API documentation and test a router response for interface-level counter fields, timestamped CPU and memory samples, and unresolved alarms with timestamps spanning the full lookback window.