
A branch reports brief throughput drops every afternoon, but five-minute SNMP polls stay under every threshold and the interface counters look clean. The engineer can add streaming telemetry from the IOS XE router to a collector. Which streaming telemetry approach gives the best evidence for identifying the cause?
Select an answer to reveal the explanation.
Short Explanation
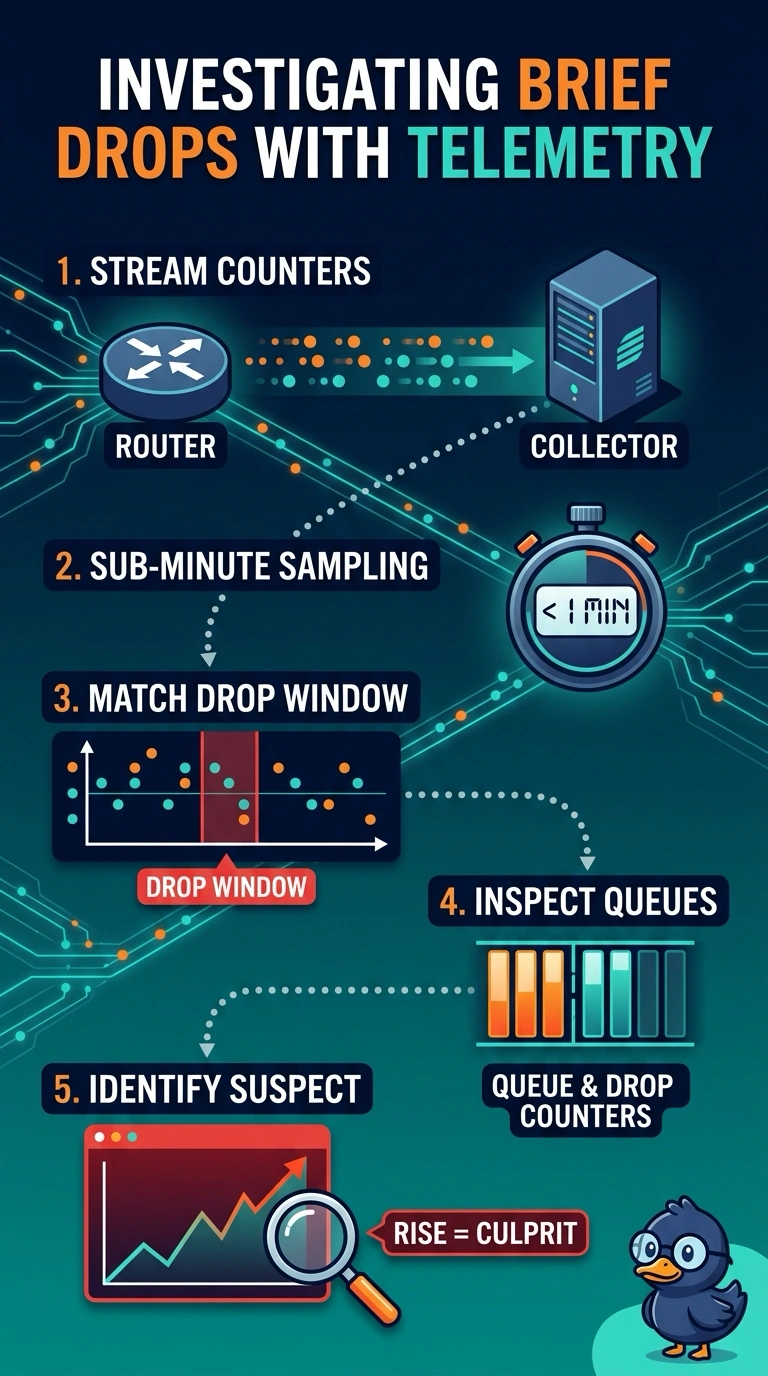
Polling gives you snapshots, while streaming telemetry provides more frequent counter samples that can reveal a brief spike between polls. Aligning the samples with the drop window helps identify interfaces whose queue or drop counters rise during the event.
Full Explanation
Model-driven telemetry can stream supported YANG-model data from the router to a collector according to a subscription. The available data and sampling intervals depend on the IOS XE platform and sensor path. For this intermittent problem, subscribe to available interface and queue statistics at a sub-minute interval, then align the samples with the reported drop window; an interface whose queue or drop counters rise at that time is a suspect. Raising the SNMP polling rate may provide more samples, but an event that begins and ends between polls can still be missed. Debug logging depends on relevant messages being generated, and enabling debugging can add device load. Ping and traceroute measurements can detect latency but do not, by themselves, identify which interface or queue caused it. Keep the subscription scoped to avoid unnecessary load on the router or collector, and verify that the observed counter changes align with the reported event.