
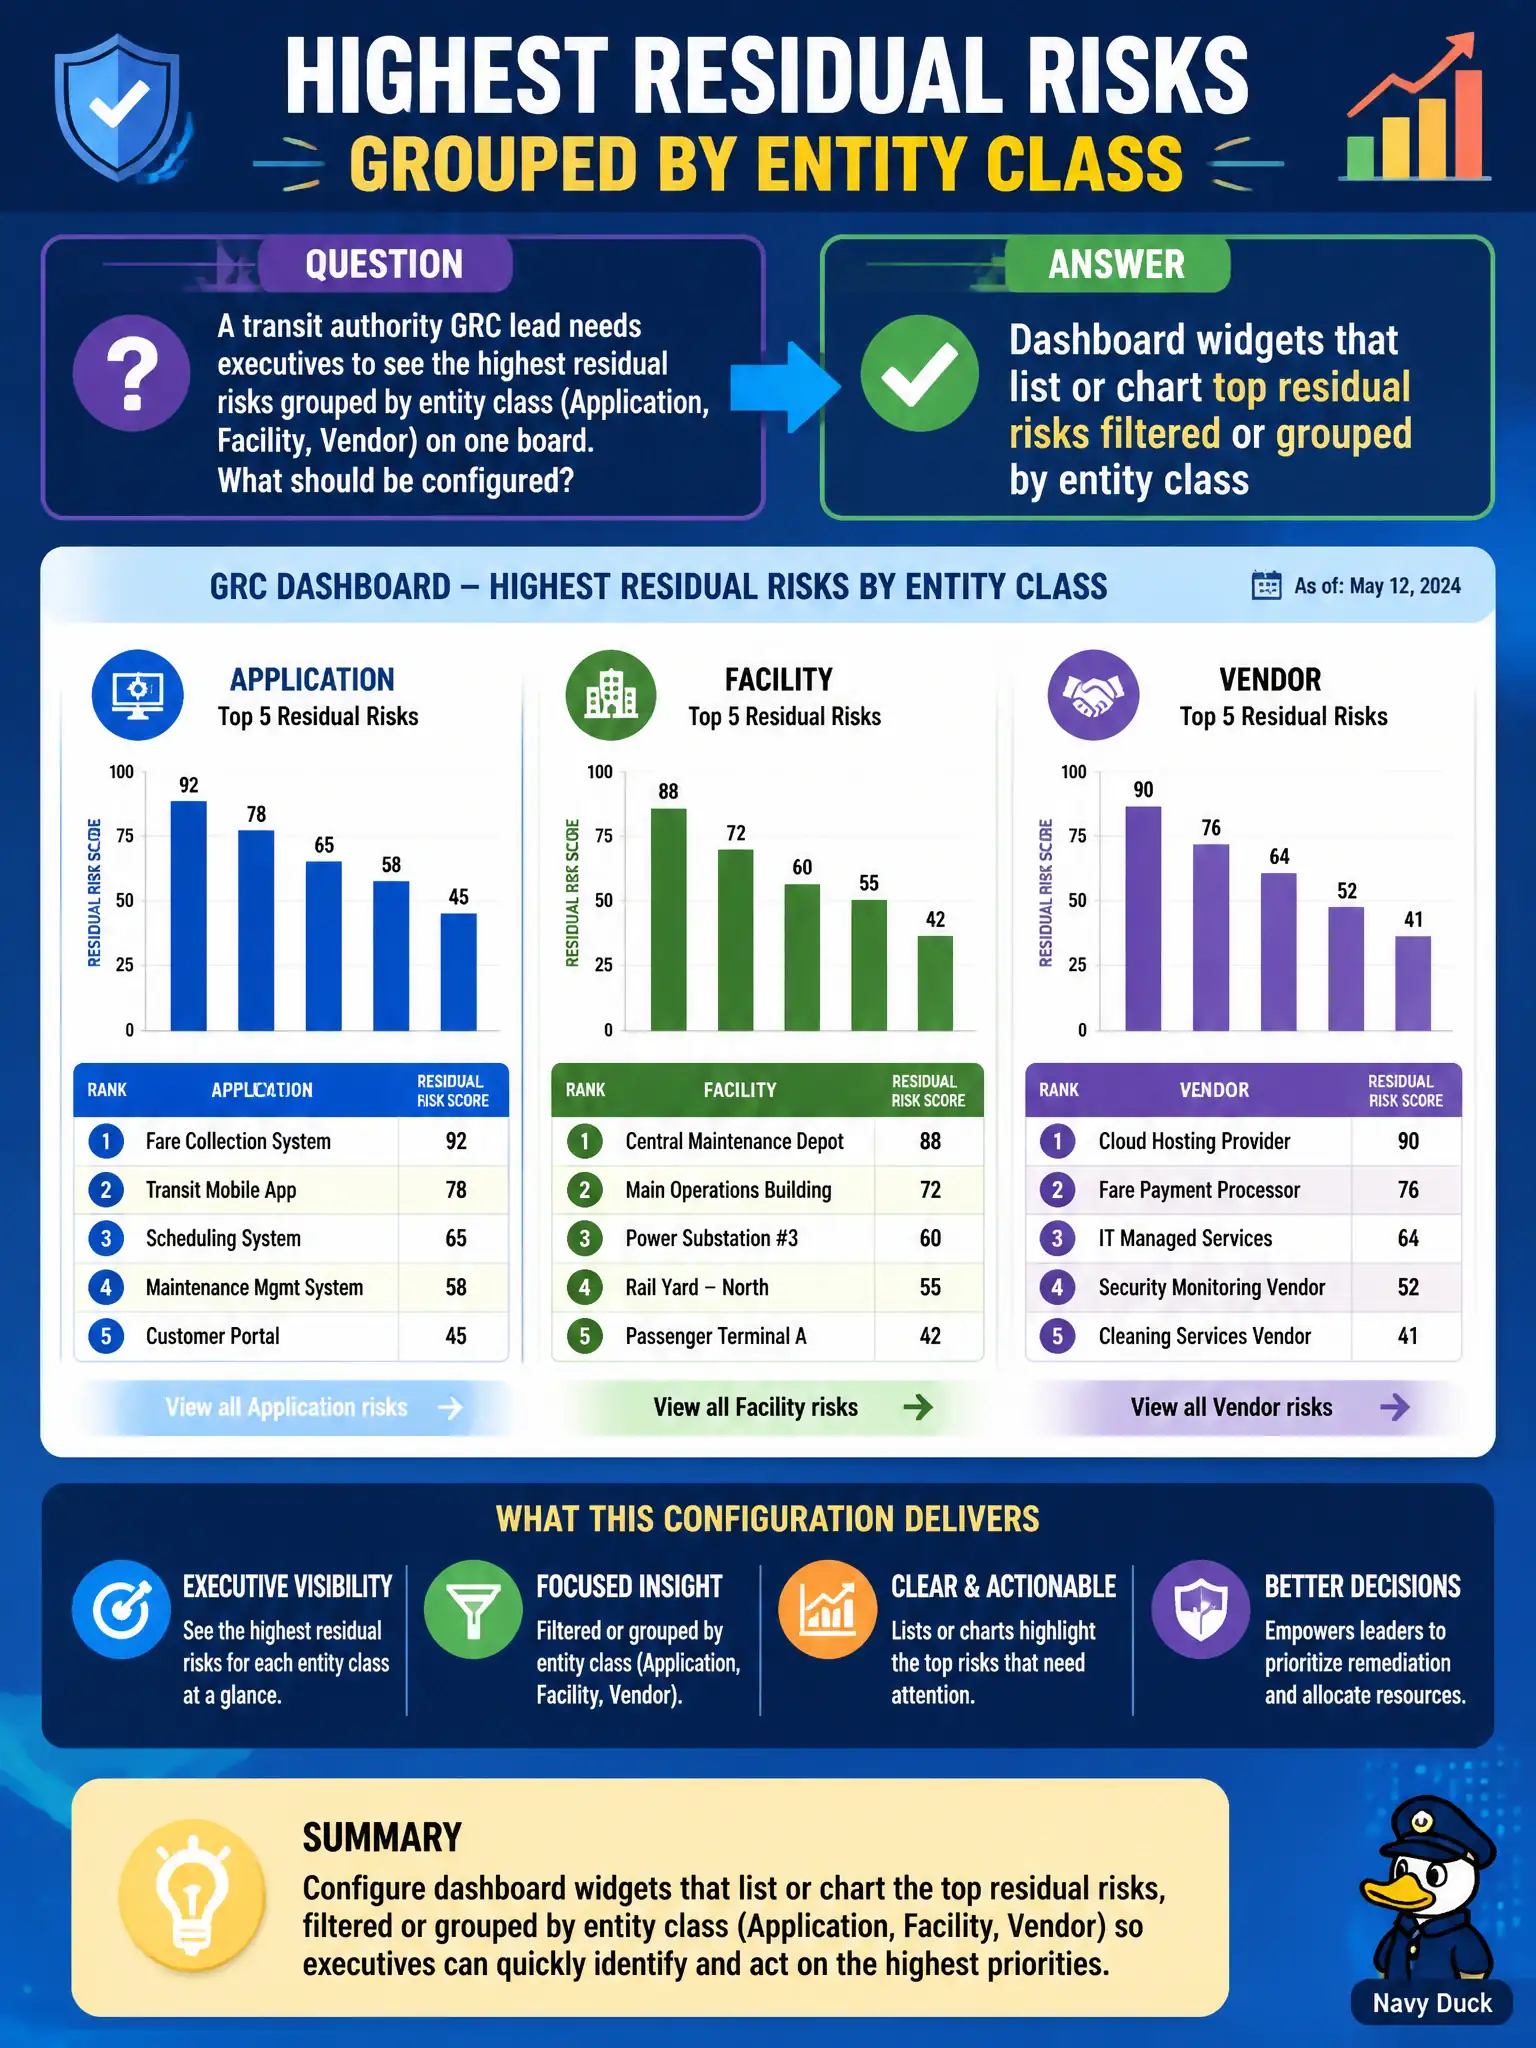
A transit authority GRC lead needs executives to see the highest residual risks grouped by entity class (Application, Facility, Vendor) on one board. What should be configured?
Select an answer to reveal the explanation.
Short Explanation
Leaders want the hottest leftover risks sorted by what kind of thing they sit on — apps, buildings, vendors. Point dashboard widgets at residual scores and group by entity class. A dusty PDF or a SIR board is the wrong instrument panel.
Full Explanation
Executives at a transit authority need highest residual risks grouped by entity class (Application, Facility, Vendor) through dashboard widgets that list or chart top residuals filtered or grouped by entity class. Live IRM-backed dashboards give one board view of where leftover risk concentrates by what kind of civic asset is affected. That is reporting architecture, not incident theater.
A single static PDF emailed quarterly with no live residual data behind it reintroduces lag and version confusion. A SIR major-incident board as the only visualization of residual risk posture conflates incidents with residual risk portfolios. Manual sticky notes on a war-room wall replacing the IRM register abandon the system of record.
Exam caveat: residual dashboards ≠ SIR incident boards. CIS-RC expects IRM residual widgets grouped by entity dimensions.
Operational check: configure top-residual widgets grouped by entity class; validate counts against the register; retire quarterly PDF-as-system-of-record habits for residual posture.
Widget filters should use entity class as a first-class dimension so Application, Facility, and Vendor residuals can be compared without exporting to spreadsheets. Schedule a weekly data-quality check that residual values on the board match live assessments within an agreed lag, and remove any process that treats the quarterly PDF as authoritative when IRM is available.