
A developer sends Claude an image of a data chart and asks 'What trend does this show?' What is the BEST description of what Claude is doing?
Select an answer to reveal the explanation.
Short Explanation and Infographic
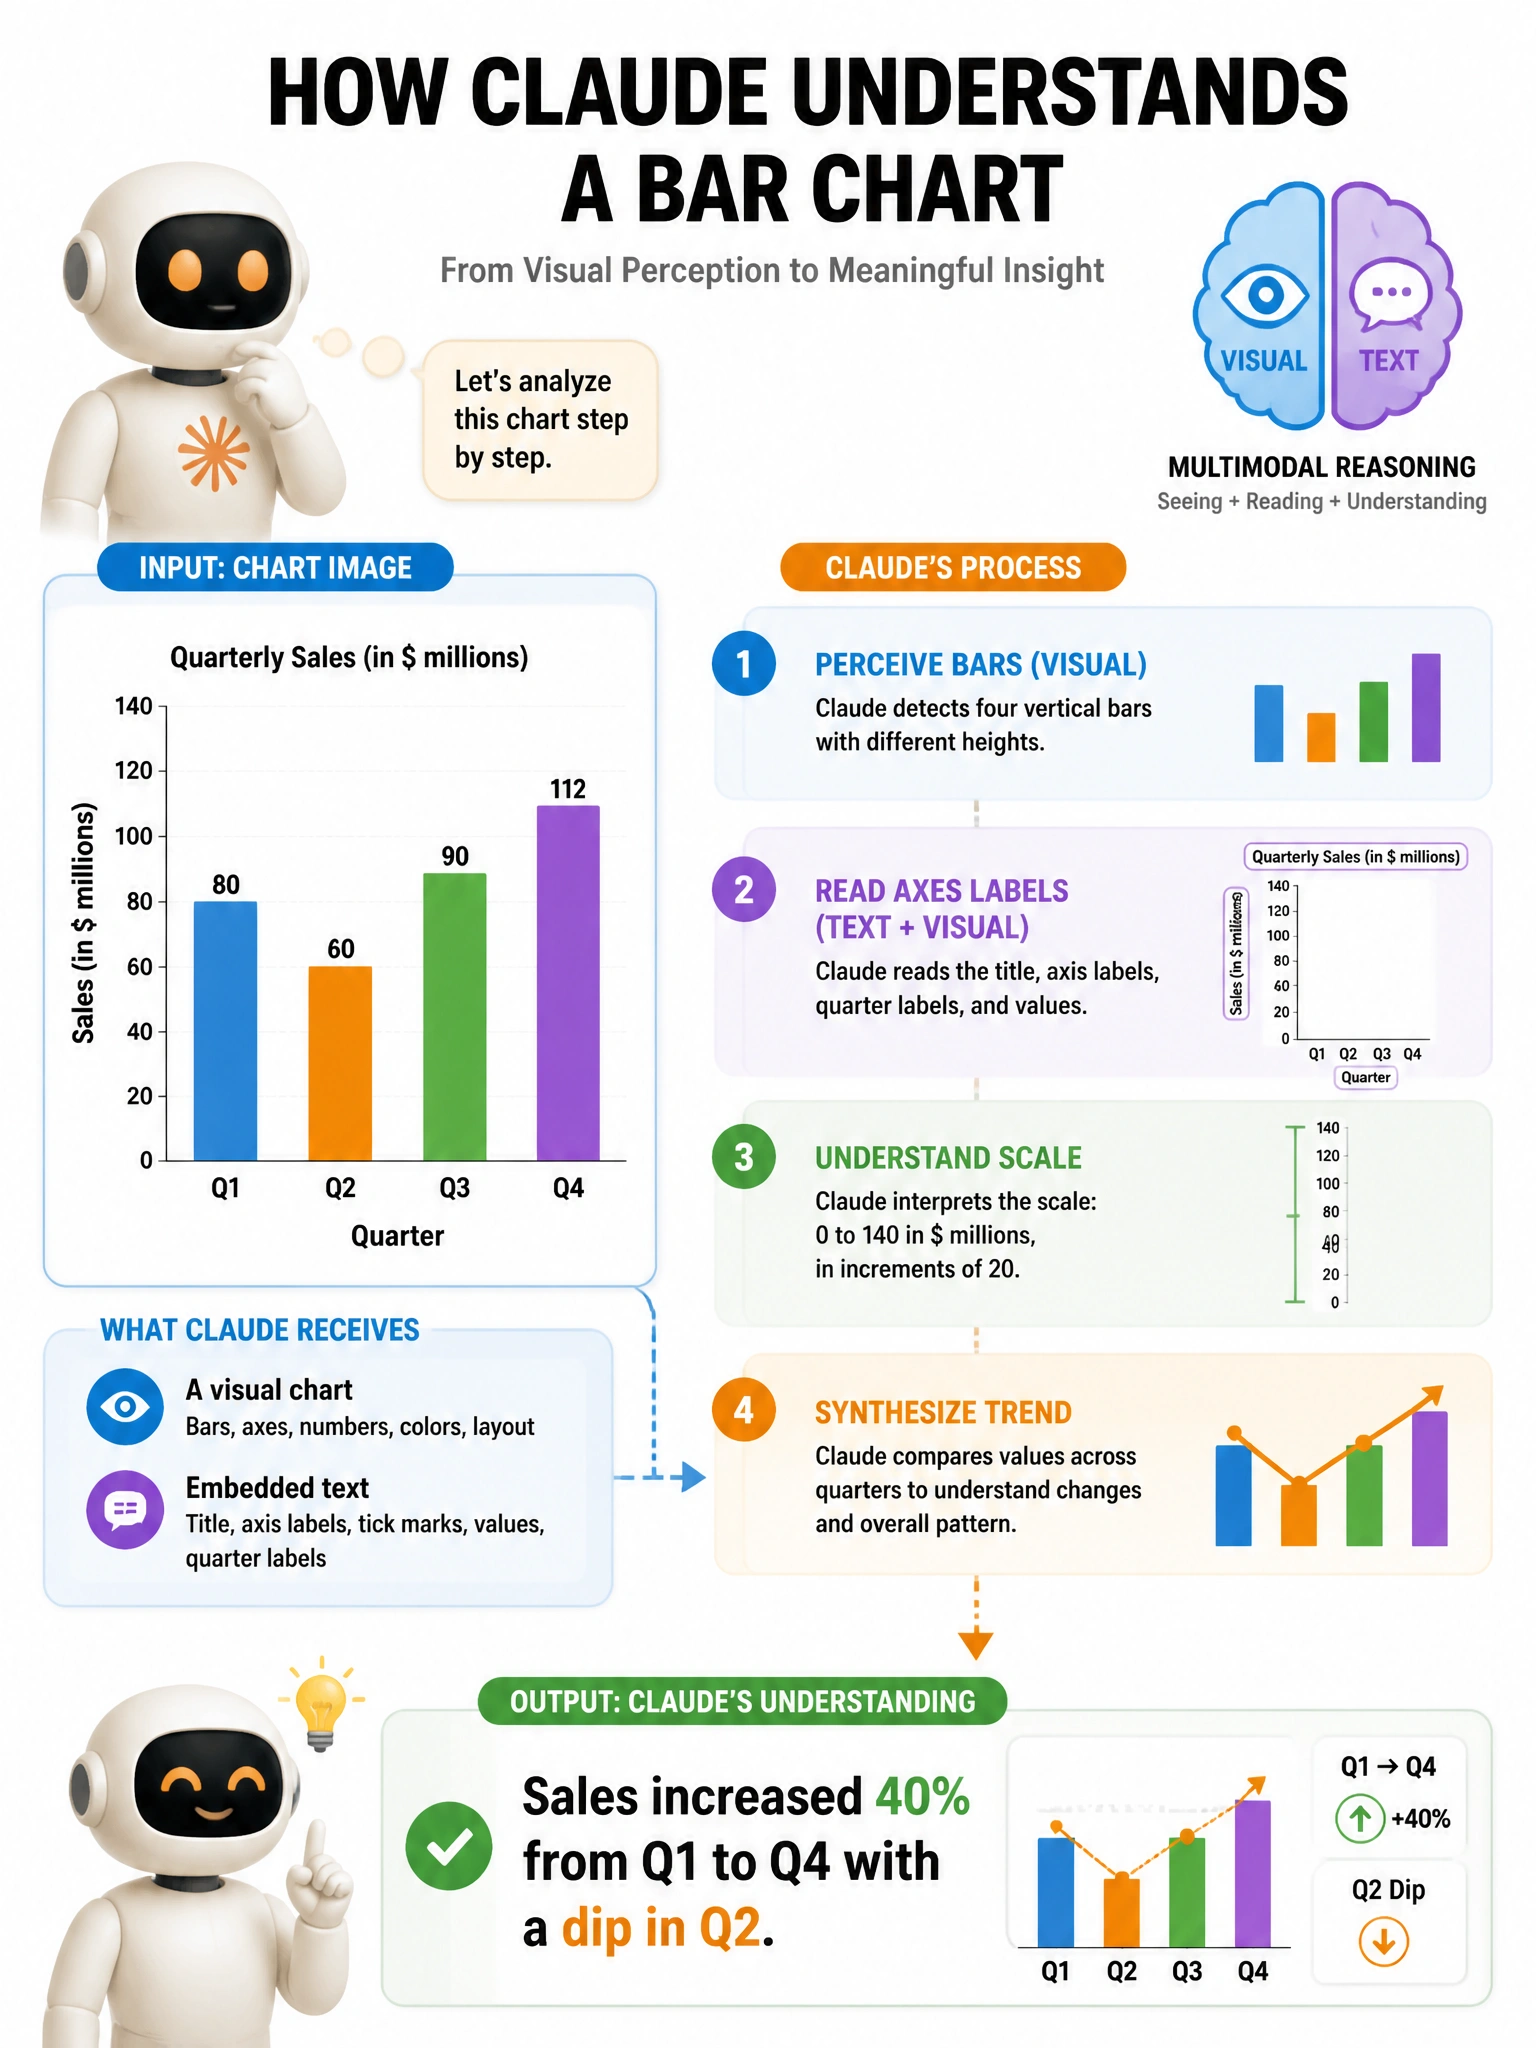
Claude actually sees the chart visually — the bars, the line direction, the axes, the colors — and reasons about what the pattern means. It's not just reading the axis labels.
Full explanation below image
Full Explanation
Claude's vision capabilities involve genuine visual understanding, not just OCR or text extraction. When analyzing a chart, Claude: perceives the visual elements (bar heights, line slopes, color coding, spatial relationships), understands chart conventions (axes, legends, scales), synthesizes visual information with any text labels to derive meaning, and produces natural language descriptions of what the chart shows. This is multimodal reasoning — combining visual perception with language understanding. Option A (converting to CSV) is wrong — Claude doesn't execute statistical software. Option C (OCR-only) underestimates Claude's visual understanding — it goes beyond text extraction. Option D (accessing original data) is wrong — Claude only sees the provided image.