
A team deployed a new version of their order-processing service at 14:32. Response times spiked sharply starting at 14:35. Which Instana capability most effectively helps the team correlate the deployment with the performance degradation during investigation?
Select an answer to reveal the explanation.
Short Explanation and Infographic
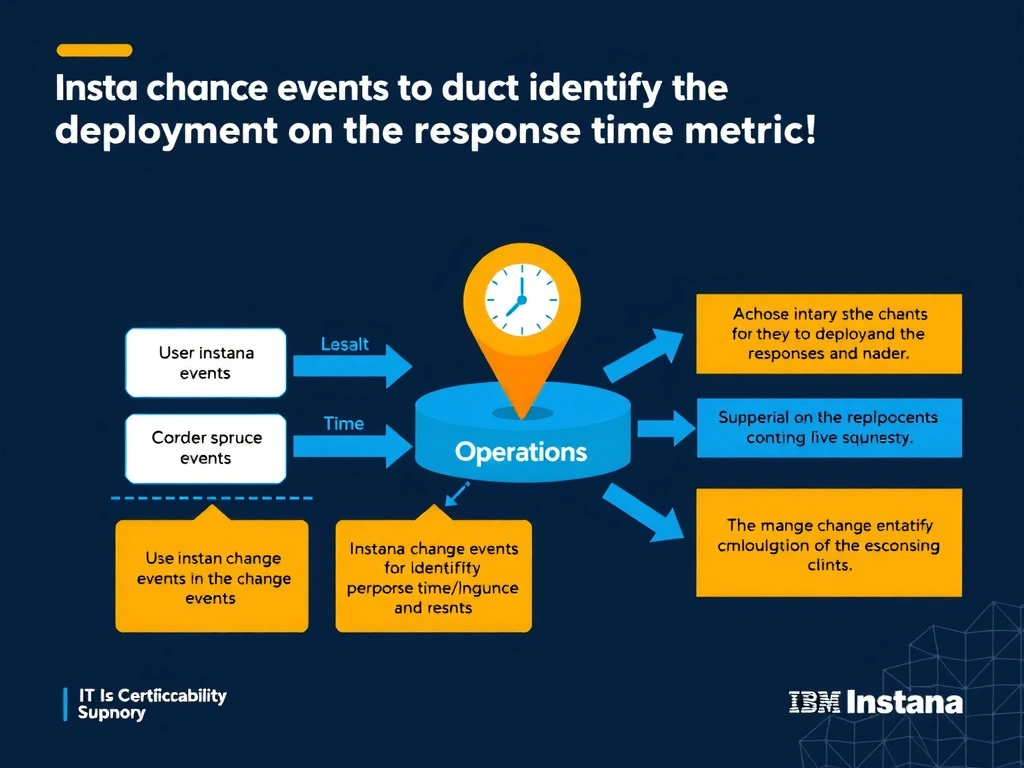
Instana's change events capture deployment and configuration changes and display them as visual markers directly on metric timelines, allowing operators to instantly see the deployment at 14:32 alongside the response time graph and identify the correlation without any manual analysis. This is the purpose-built feature for exactly this scenario. A custom dashboard comparison requires additional setup time and does not provide the automatic deployment marker overlay that change events deliver.
Full explanation below image
Full Explanation
Instana's change events capture deployment and configuration changes and display them as visual markers directly on metric timelines, allowing operators to instantly see the deployment at 14:32 alongside the response time graph and identify the correlation without any manual analysis. This is the purpose-built feature for exactly this scenario. A custom dashboard comparison requires additional setup time and does not provide the automatic deployment marker overlay that change events deliver. The correct answer is 'Use Instana change events to identify the deployment marker overlaid on the response time metric timeline'. The incorrect options — 'Search application logs within Instana for entries around the 14:32 deployment timestamp', 'Build a custom dashboard comparing average response times before and after 14:32', 'Review the Instana agent configuration file on the order-processing service host' — are wrong because they do not align with IBM Instana's architecture or recommended practices for this scenario. Understanding this concept is essential for the Domain 1: Operations domain of the IBM Instana Observability certification.