
Where in watsonx.data can an administrator monitor the status and resource usage of currently running Presto queries?
Select an answer to reveal the explanation.
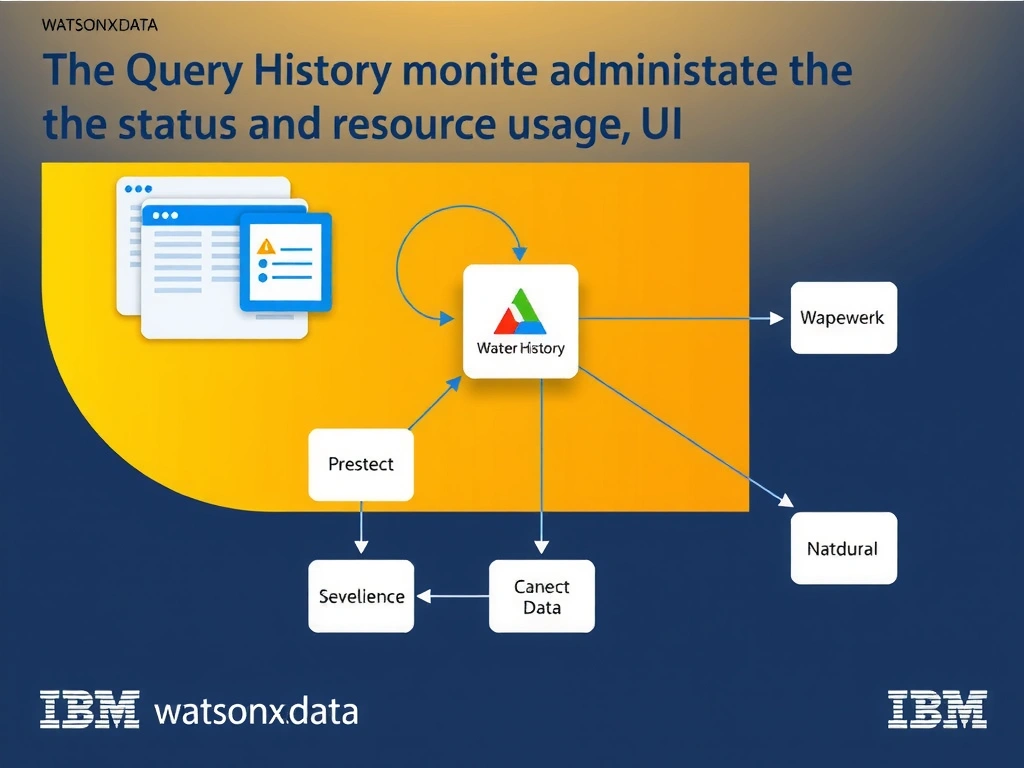
Short Explanation and Infographic
watsonx.data provides a query monitoring interface where administrators can view active; queued; and recently completed Presto queries along with their resource consumption; duration; and execution plan.
Full explanation below image
Full Explanation
watsonx.data provides a query monitoring interface where administrators can view active; queued; and recently completed Presto queries along with their resource consumption; duration; and execution plan. The incorrect options ("The IBM Cloud Cost Estimator dashboard", "The IBM Cloud Object Storage metrics console", "The Apache Spark History Server accessible through the Spark engine URL") are distractors that don't fully capture the concept described.