You've built a customer segmentation model, and in an effort to make it as accurate as possible, you keep adding new features—tracking everything from daily website clicks to zip codes, ending up with over 500 features. Suddenly, you notice your model's performance drops, and data points that used to be clearly grouped now seem equidistant from one another. What concept explains this phenomenon?
Select an answer to reveal the explanation.
Short Explanation and Infographic
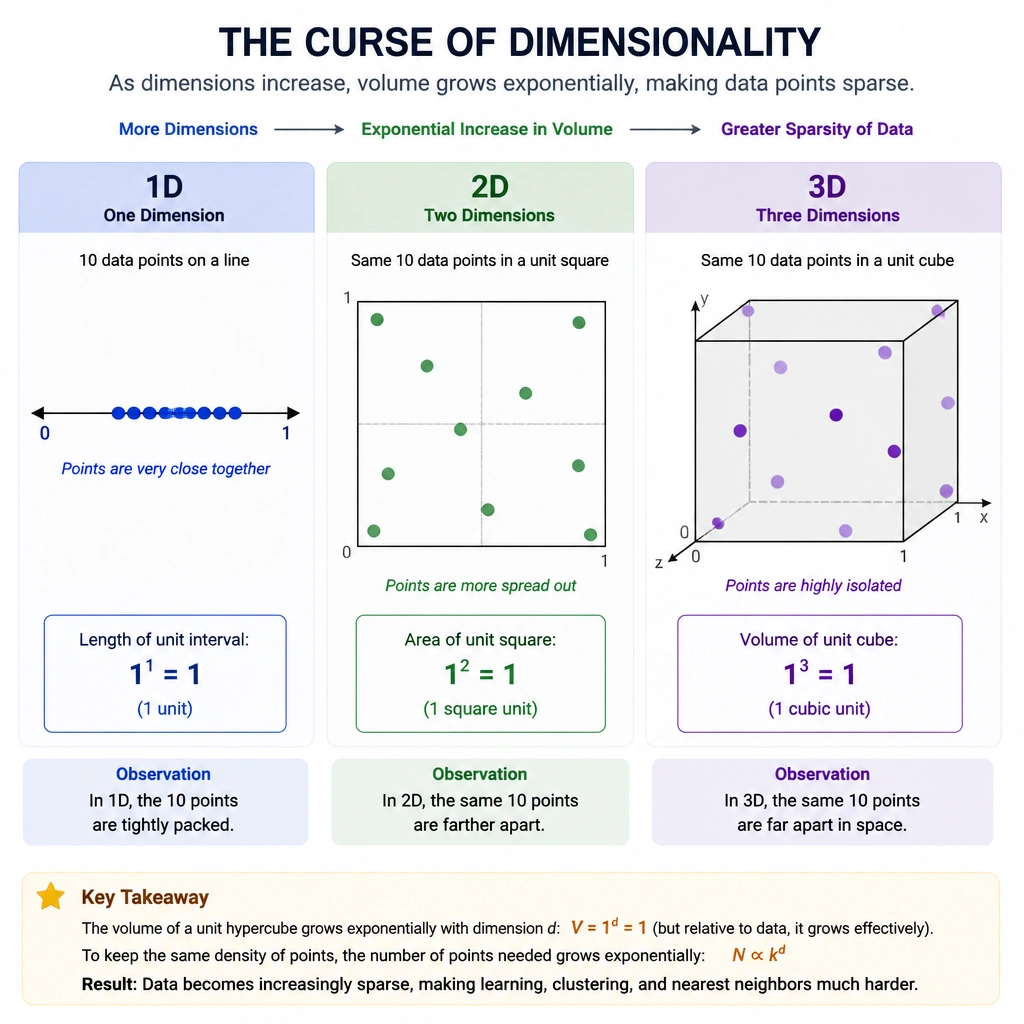
Here's the deal—it's easy to think that more data is always better, but adding columns (dimensions) to your table can actually wreck your model. Think of it like this: if you lose a coin on a 10-foot line (1D), it's easy to find. If you lose it in a 10x10 foot room (2D), it takes a bit more effort. But if you toss it into a 10x10x10 foot cube (3D), it's way harder. Now, imagine a 500-dimensional room! The volume of that space is so mind-bogglingly huge that your data points are scattered like dust in outer space. Because everything is so far apart, every point looks equally distant from every other point, and your distance-based algorithms just give up. That's the curse of dimensionality, and it's why you have to keep your feature count in check.
Full explanation below image
Full Explanation
The "curse of dimensionality" refers to various phenomena that arise when analyzing and organizing data in high-dimensional spaces (often hundreds or thousands of dimensions) that do not occur in low-dimensional settings.
As the dimensionality (number of features) increases, the volume of the space grows exponentially. Consequently, the available data points become extremely sparse within this massive space. For any machine learning algorithm to find a reliable statistical pattern, the amount of data required to maintain a given density of data points must grow exponentially with the number of dimensions. Without an exponential increase in the size of the training dataset, models are prone to overfitting because they can easily find spurious patterns in the sparse space.
Additionally, distance-based metrics (such as Euclidean distance) lose their effectiveness in high-dimensional spaces. As the number of dimensions increases, the distance between any two points in the dataset converges to the same value. Because the maximum distance and minimum distance between points become virtually identical, algorithms that rely on distance calculations (such as K-Means clustering, K-Nearest Neighbors, or anomaly detection) fail to differentiate between close and distant points.
Let's look at why the other options are incorrect: - The vanishing gradient problem (Option A) is a neural network training issue where gradients become too small to update early layers, which is unrelated to the geometric sparsity of input features. - High bias (Option C) represents underfitting (when a model is too simple to capture patterns), whereas high-dimensional sparsity typically leads to high variance and overfitting. - Covariance shift (Option D) is a form of dataset shift where the input distribution changes over time, which is an operational issue rather than a structural issue caused by high feature counts.
Therefore, the curse of dimensionality (Option B) is the correct term for spatial volume expansion causing data sparsity.