
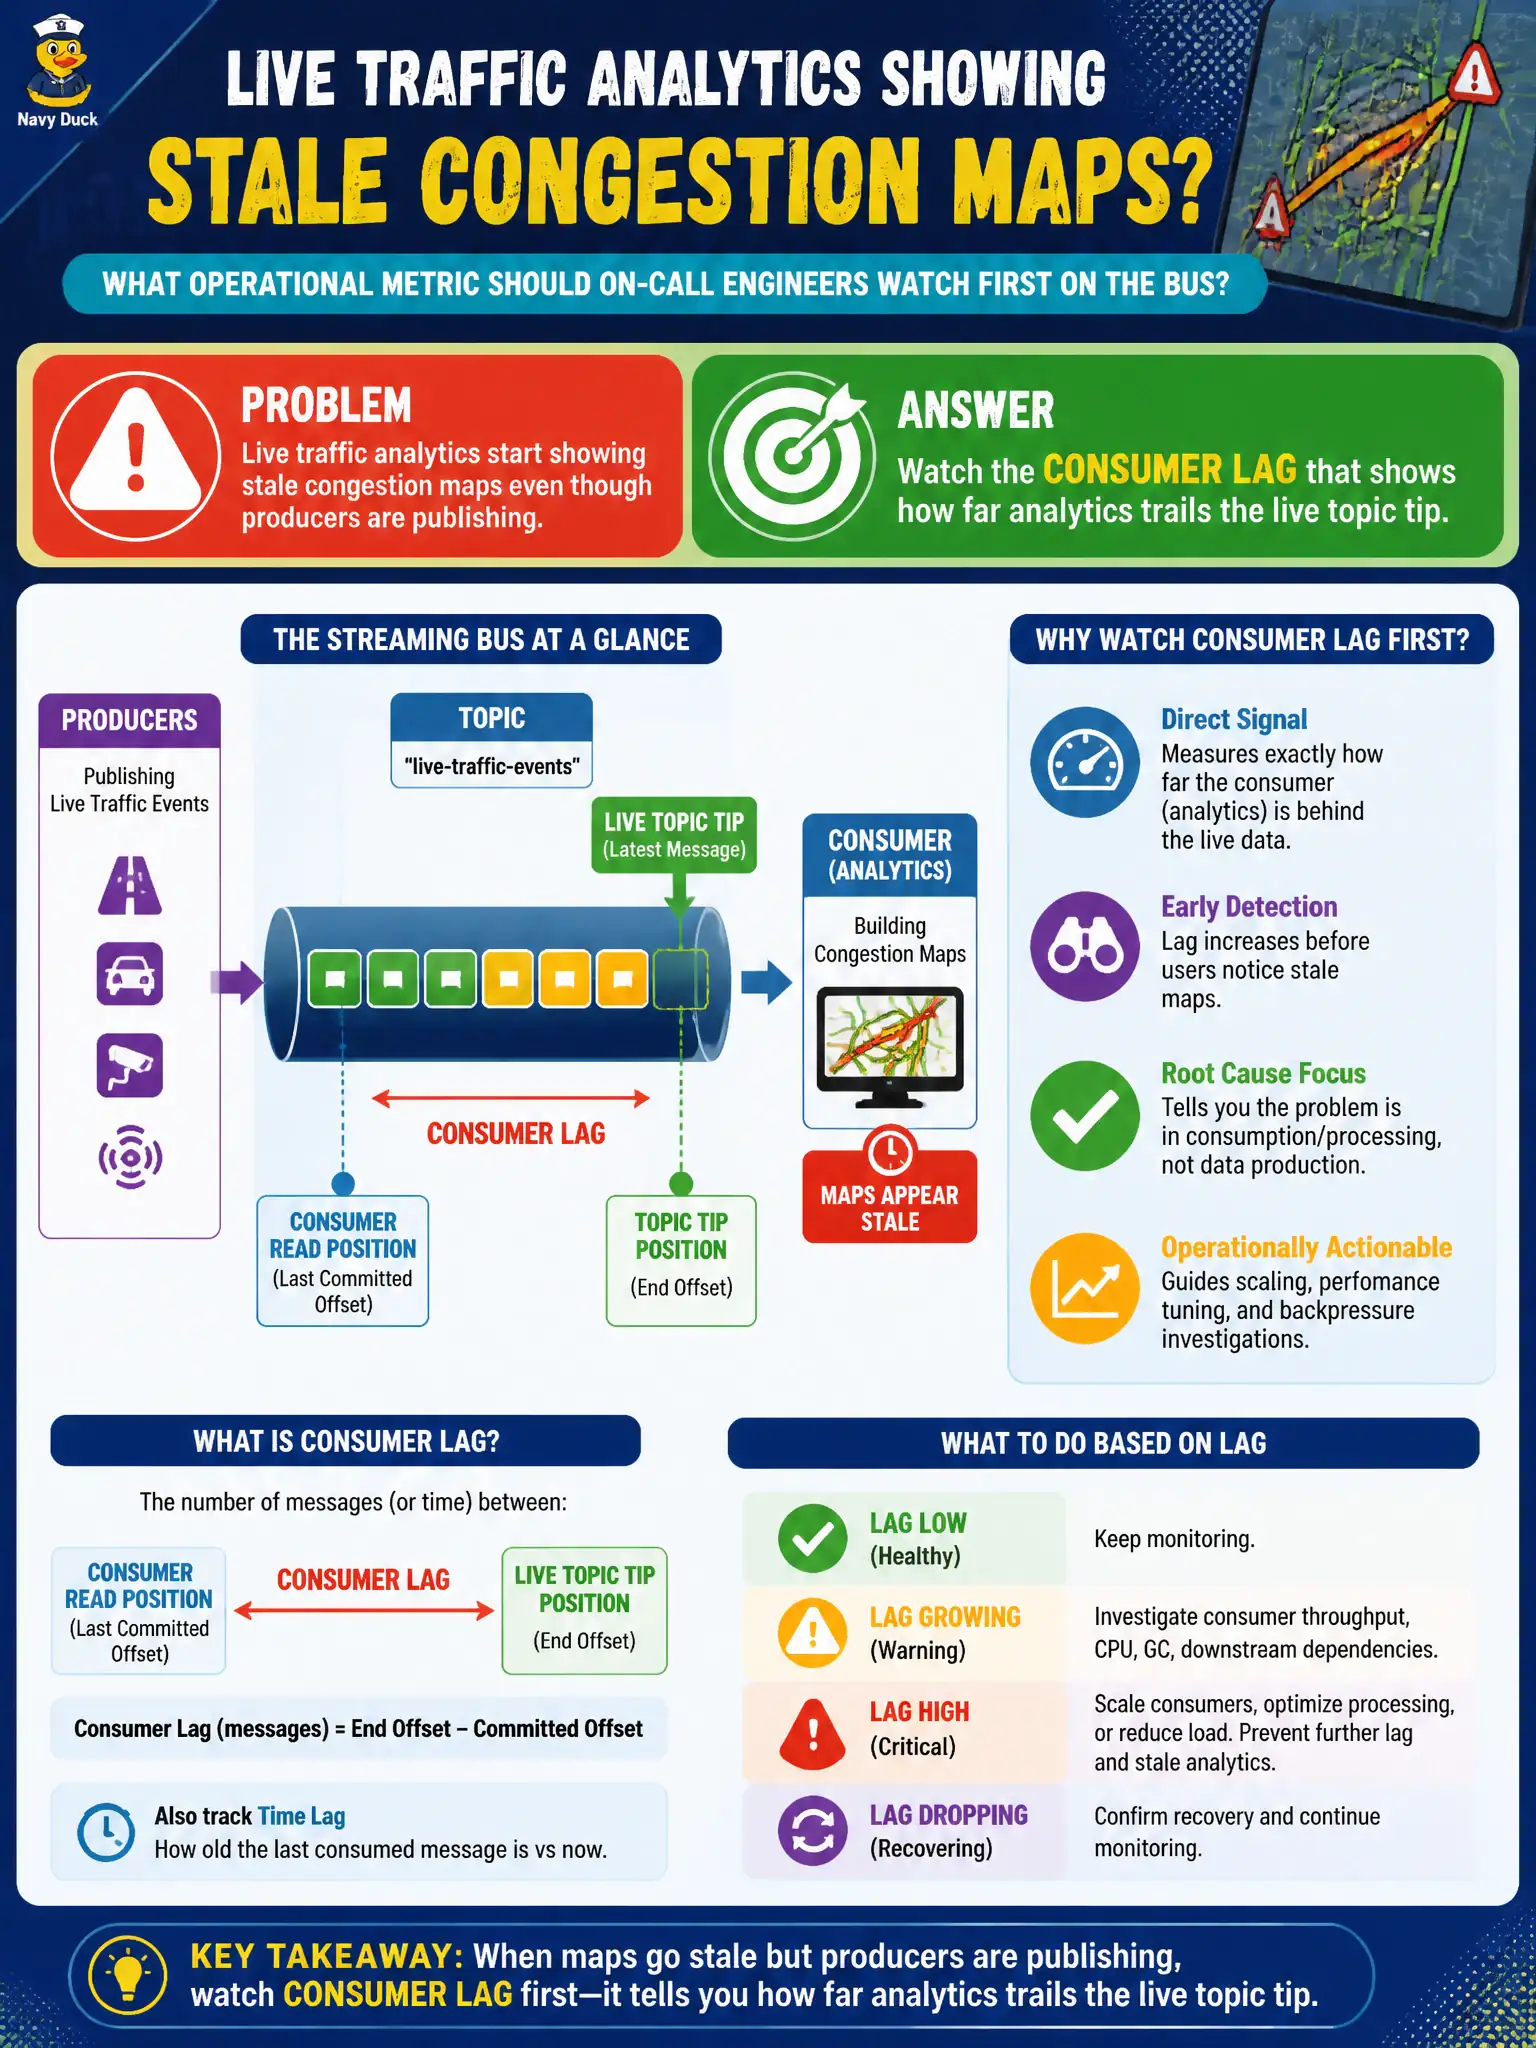
Live traffic analytics start showing stale congestion maps even though producers are publishing. Which operational metric should on-call engineers watch first on the bus?
Select an answer to reveal the explanation.
Short Explanation
If maps feel old while sensors still chatter, check consumer lag—how far behind the tip your readers sit. It is the speedometer for “are we keeping up?” on a city event bus. Stale dashboards often mean lag, not silent producers.
Full Explanation
Consumer lag measures how far analytics trail the live tip of the traffic topic and is the first operational metric to inspect when congestion maps look stale despite active producers. Rising lag indicates consumers cannot keep up or are stalled, which directly explains outdated civic dashboards that still appear “connected.” On-call engineers use lag together with throughput and error rates to decide whether to scale, restart, or chase poison messages on the bus.
Watching only HDFS block replication while ignoring messaging consumers looks at the wrong subsystem for a live bus staleness symptom. CPU temperature of analyst laptops in the traffic center does not explain topic-to-dashboard delay on the shared municipal bus. Monthly CapEx reports for messaging hardware are planning artifacts, not real-time indicators of why today’s congestion map is behind the producers.
Exam caveat: lag must be interpreted with retention and consumer health—zero lag with empty output can mean a silent filter bug, while high lag with healthy throughput may be expected catch-up after a deploy. Operational check: compare consumer group lag charts to wall-clock map age, restart or scale a lagging consumer in a drill, and confirm lag and map freshness recover together under the on-call runbook.