
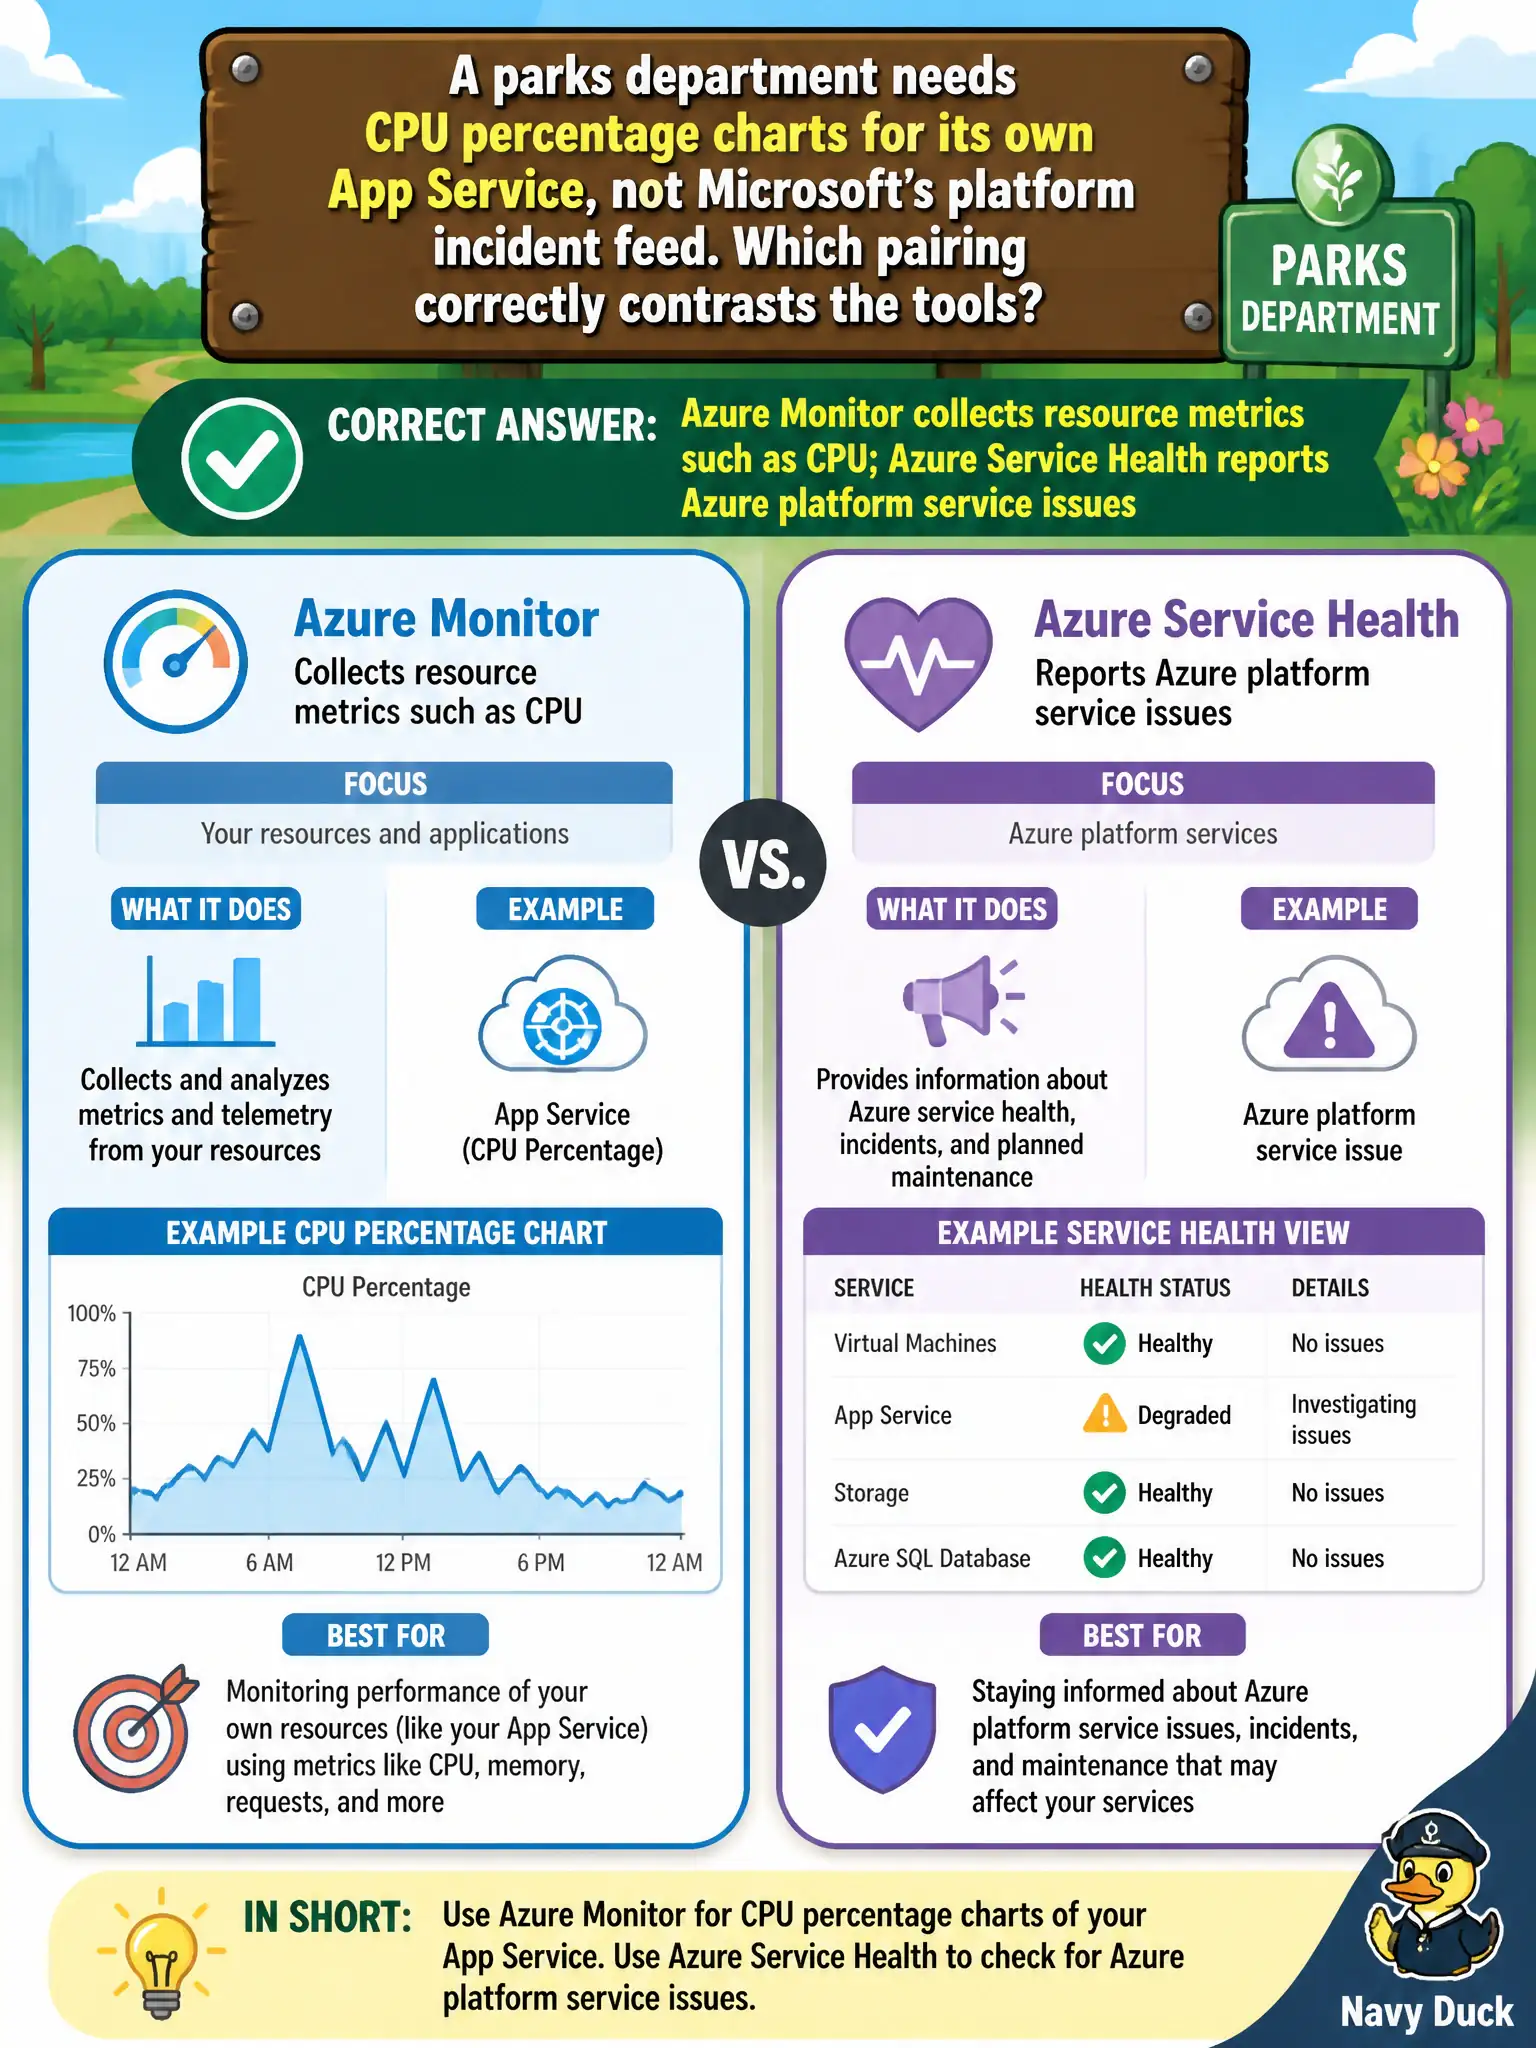
A parks department needs CPU percentage charts for its own App Service, not Microsoft's platform incident feed. Which pairing correctly contrasts the tools?
Select an answer to reveal the explanation.
Short Explanation
Monitor watches your stuff—CPU, logs, alerts on your resources. Service Health watches Azure's stuff—platform incidents and maintenance. Mix them up and you will look in the wrong toolbox.
Full Explanation
Azure Monitor collects telemetry from the parks department's own resources—metrics such as App Service CPU percentage, plus logs and alerts—while Azure Service Health reports Azure platform service issues and maintenance affecting subscriptions. That pairing keeps customer resource observability separate from Microsoft's service status feed. For CPU charts on the city's App Service, Monitor is the correct home; Service Health answers whether Azure itself is impaired.
Reversing the tools—Service Health graphing guest CPU while Monitor only lists Microsoft outages—fails because those responsibilities are swapped. Saying both tools only show pricing estimates fails because neither is primarily a pricing calculator; Cost Management handles cost analysis. Saying Monitor and Service Health are identical products with different logos fails because they address different questions and appear as distinct experiences in Azure.
Exam caveat: during an incident, teams often check both—Service Health for platform root cause and Monitor for how the application's metrics and alerts behaved—without treating them as synonyms.
Operational check: open Azure Monitor metrics for the App Service CPU chart, then open Service Health in another blade; confirm you cannot get the same CPU time series from Service Health, reinforcing the correct contrast.