
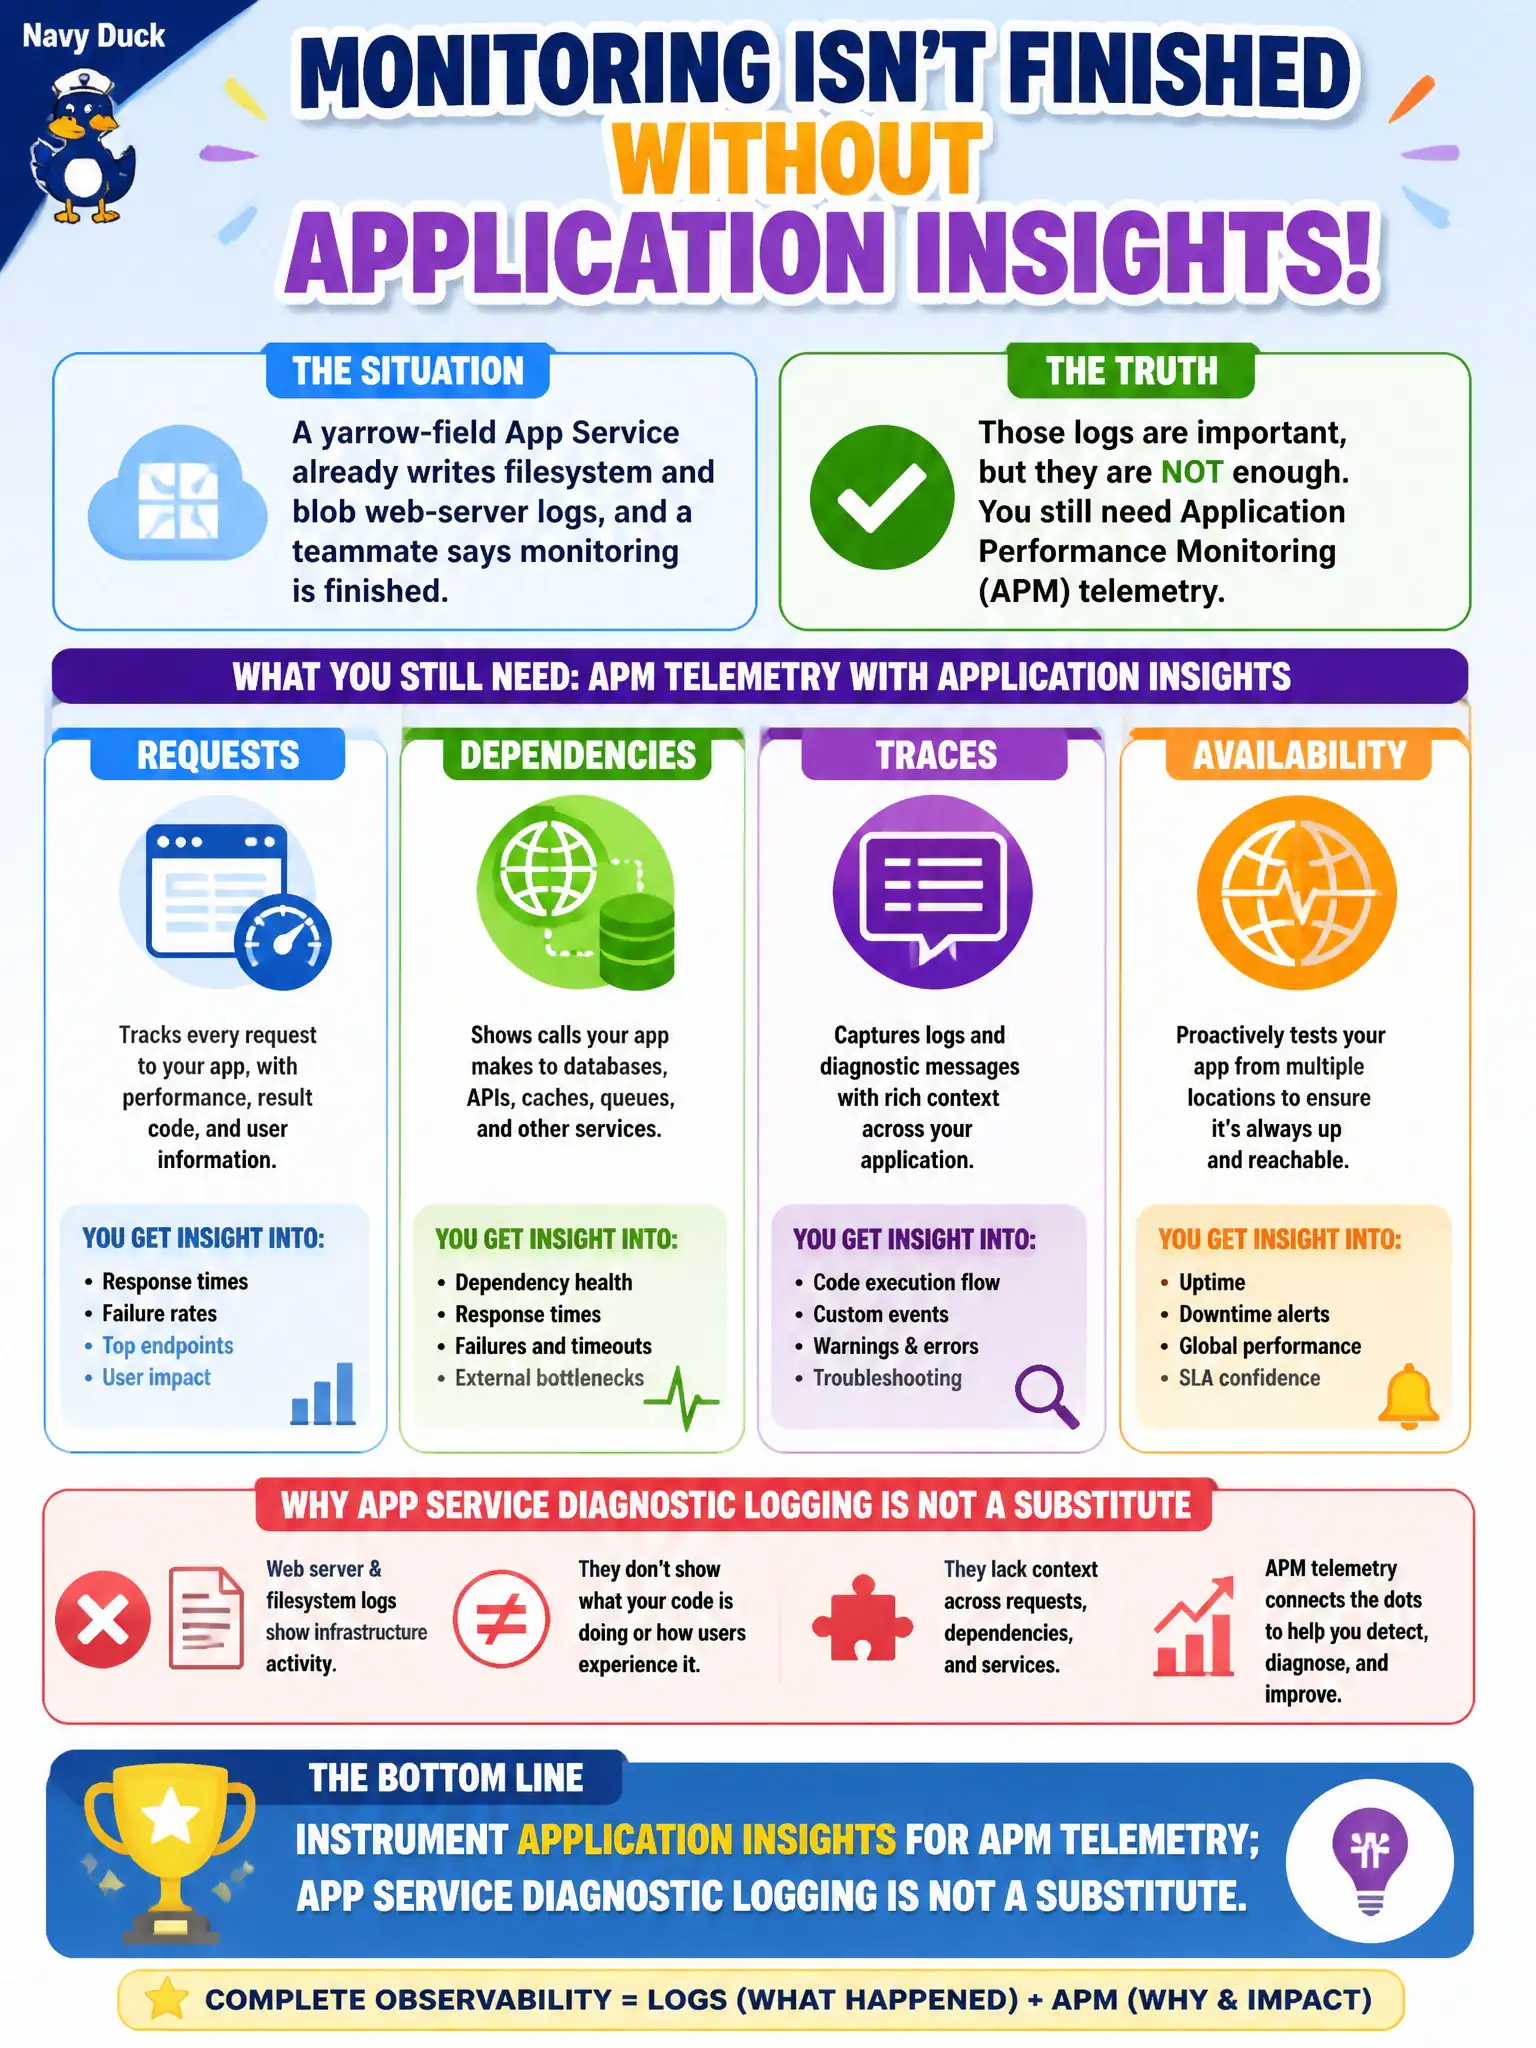
A yarrow-field App Service already writes filesystem and blob web-server logs, and a teammate says monitoring is finished. What should the developer still add for requests, dependencies, traces, and availability?
Select an answer to reveal the explanation.
Short Explanation
Web-server logs and Application Insights are different tools. Domain 1 filesystem/blob logging is not Domain 4 APM—wire Insights if you need requests, dependencies, traces, and availability.
Full Explanation
App Service diagnostic logging (filesystem and blob web-server or application logs) is useful for operational debugging of the yarrow-field site, but it is not Application Performance Management. To capture requests, dependencies, traces, exceptions, and availability tests end to end, the developer must instrument Application Insights (SDK or agent with a connection string) so APM telemetry flows to Insights and, when workspace-based, into Log Analytics.
Raising the App Service plan SKU only changes compute capacity and SLA characteristics; it does not magically turn IIS or platform log streams into distributed tracing. Moving the workload to Queue Storage replaces a request/response web surface with asynchronous messages and does not produce APM request maps. Redis hit-rate metrics speak to cache effectiveness, not outbound dependency chains, custom traces, or synthetic availability probes.
Exam caveat: Domain-style App Service logging and Application Insights solve different monitoring layers—having one does not retire the other when the requirement explicitly lists requests, dependencies, traces, and availability.
Operational check: enable Insights on the App Service (or inject the SDK), confirm Live Metrics or the Application Map shows traffic after a test call, and verify that availability tests or dependency calls appear in the Insights experience rather than only in Log stream or blob web-server files.