
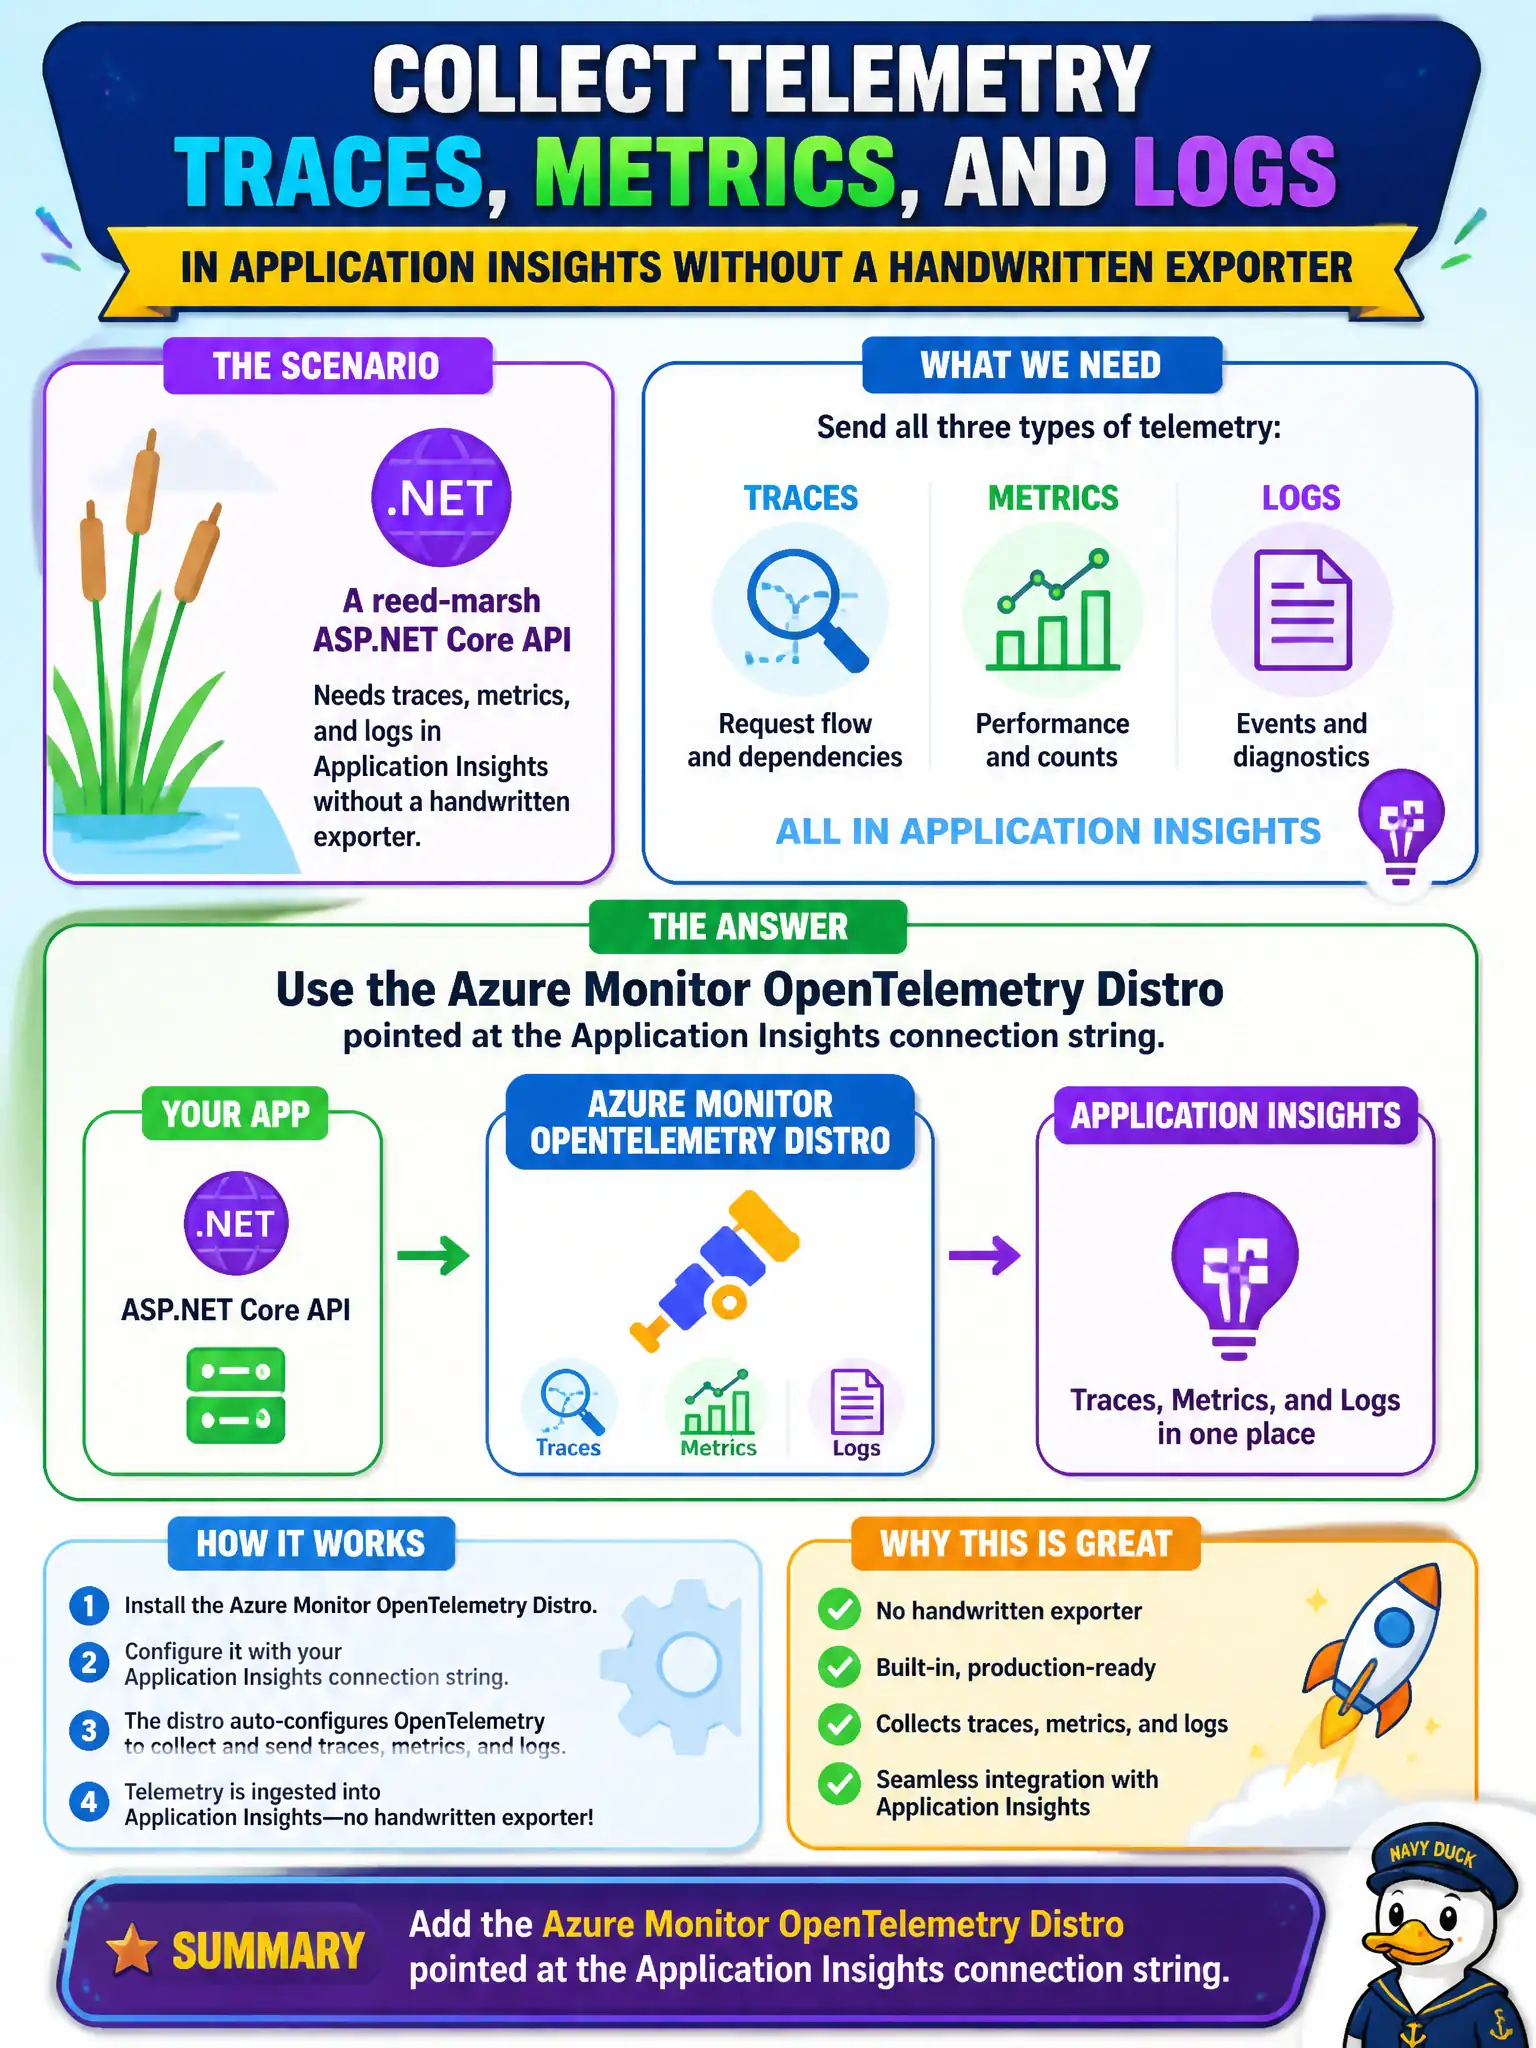
A reed-marsh ASP.NET Core API needs traces, metrics, and logs in Application Insights without a handwritten exporter. What should the developer add?
Select an answer to reveal the explanation.
Short Explanation
Azure Monitor OpenTelemetry Distro is the current server path—drop it in, set the connection string, ship traces/metrics/logs. Skip homemade exporters and Redis “telemetry.”
Full Explanation
The Azure Monitor OpenTelemetry Distro is the recommended server instrumentation path for ASP.NET Core and similar apps targeting Application Insights. For the reed-marsh API that needs traces, metrics, and logs without a handwritten exporter, add the Distro and point it at the Application Insights connection string. That official package wires export of the three signals without custom UDP plumbing.
Only a hand-rolled UDP exporter that ignores Microsoft’s server instrumentation guidance fails because homemade exporters skip supported semantic conventions, live metrics integration, and documented Azure Monitor export paths.
Azure Cache for Redis as the only telemetry pipeline fails because Redis is not an Application Insights or OpenTelemetry export destination for traces, metrics, and logs.
A Logic Apps workflow that polls logs every hour instead of instrumenting the API fails because periodic polling is not in-process instrumentation and cannot provide timely distributed traces from the API itself.
Exam caveat: Distro setup still requires the correct connection string and package versions; mixing obsolete App Insights SDK patterns carelessly with OpenTelemetry can duplicate or drop signals—follow the current Distro quickstart. Operational check: after adding the Distro, hit an API route, then confirm a request, a dependency (if any), and a log record appear in the Insights resource.