
A grocery chain wants the depth of an application queue, a number the application already computes, on a CloudWatch graph. Default EC2 metrics show CPU only. What should the application publish?
Select an answer to reveal the explanation.
Short Explanation
The hypervisor does not know how long your line is. You publish that number yourself as a custom metric. Detailed monitoring only asks the same EC2 counters more often, and it will not invent a queue.
Full Explanation
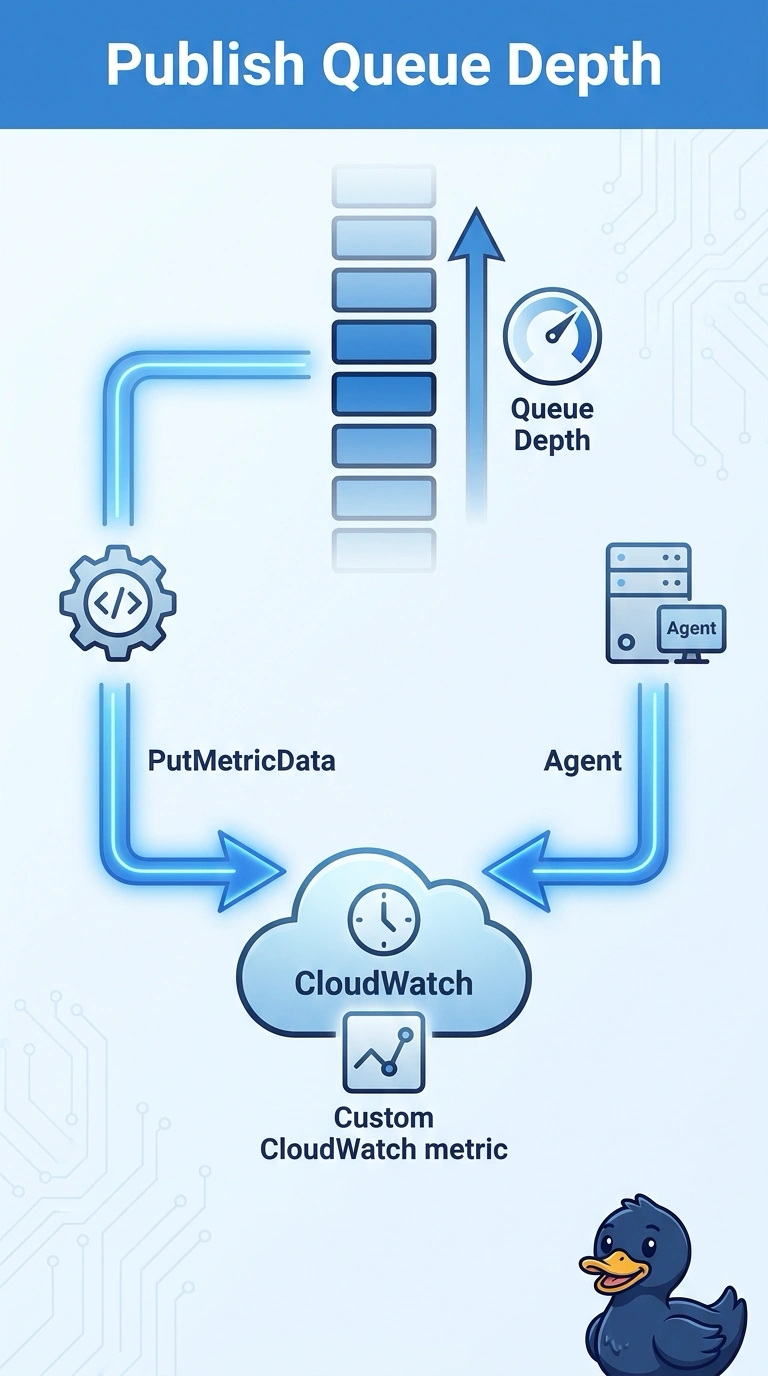
Queue depth is an application measurement. The application, or the CloudWatch agent reading a value the application exposes, publishes it as a custom metric with PutMetricData. Default EC2 metrics and detailed monitoring only cover the hypervisor counters such as CPU; they do not add application fields. CloudTrail records API calls, and a management event is a poor and incomplete substitute for a gauge you want to graph and alarm on. Flow logs cannot be given a queue-depth field; they describe packets. Caveat: send the metric with stable dimensions, or the alarm you add later will sit in insufficient data because it does not match the series. Operational check: after one publish, graph the custom metric and confirm the value matches the queue the application reports. PutMetricData needs a namespace you choose, a metric name such as queue depth, and dimensions you will reuse in the alarm. The application role or the agent role needs cloudwatch:PutMetricData. Publish on a steady period so the alarm's evaluation is not looking at a series that only appears when someone remembers to send a sample.