
A grocery chain sees CPU on every EC2 graph in CloudWatch, but memory-used percent does not appear for any instance. The instances run Amazon Linux and no extra agent is installed. What should the team configure so memory becomes a CloudWatch metric?
Select an answer to reveal the explanation.
Short Explanation
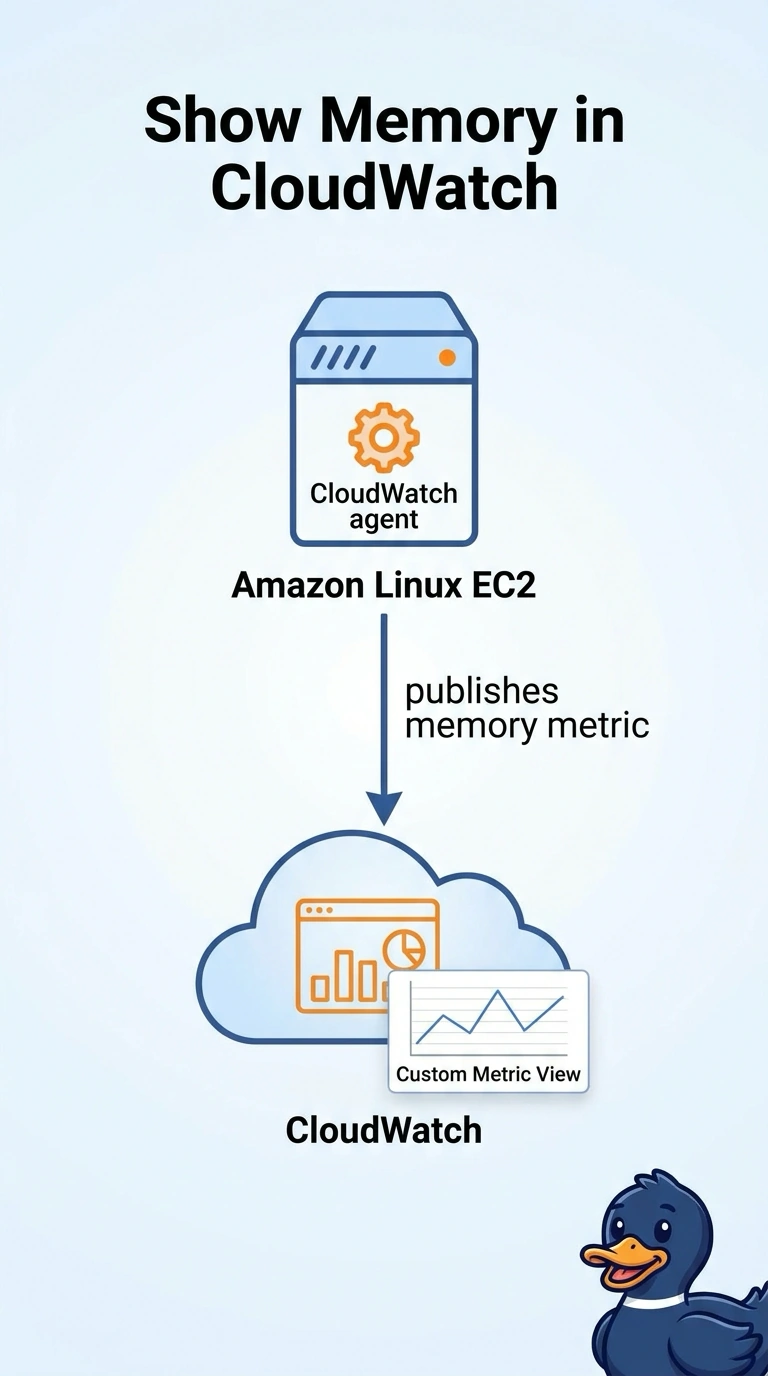
The hypervisor will tell you how hard the CPU is working and stay quiet about the guest's memory. You ask the guest yourself, and on EC2 that ask is the CloudWatch agent. Turning on detailed monitoring only asks the same hypervisor more often.
Full Explanation
Default EC2 metrics come from the hypervisor and include CPU, network, and status checks, not memory used inside the operating system. The CloudWatch agent runs in the guest and publishes that memory metric into CloudWatch. Detailed monitoring shortens the period of the existing EC2 metrics; it does not add guest memory. CloudTrail records API calls, not operating-system counters. VPC Flow Logs describe accepted and rejected flows, not host memory. Caveat: the agent still needs an instance profile that can publish metrics, or the metric you configured never arrives. Operational check: after the agent starts, find the memory metric in the namespace the agent config names and confirm a datapoint from one instance before you roll the config to the fleet.