
A fintech API on EKS must meet 99.9% success and p95 latency under 300 ms, needs burn-rate alerts to page before budget exhaustion. Which SLO design creates measurable indicators and alerts with Application Signals?
Select an answer to reveal the explanation.
Short Explanation
Uptime promises need teeth, or they're just wishes on paper. You'll track what users feel and get early warnings via burn rate math. Signals SLOs tied to paging keep that 99.9 honest.
Full Explanation
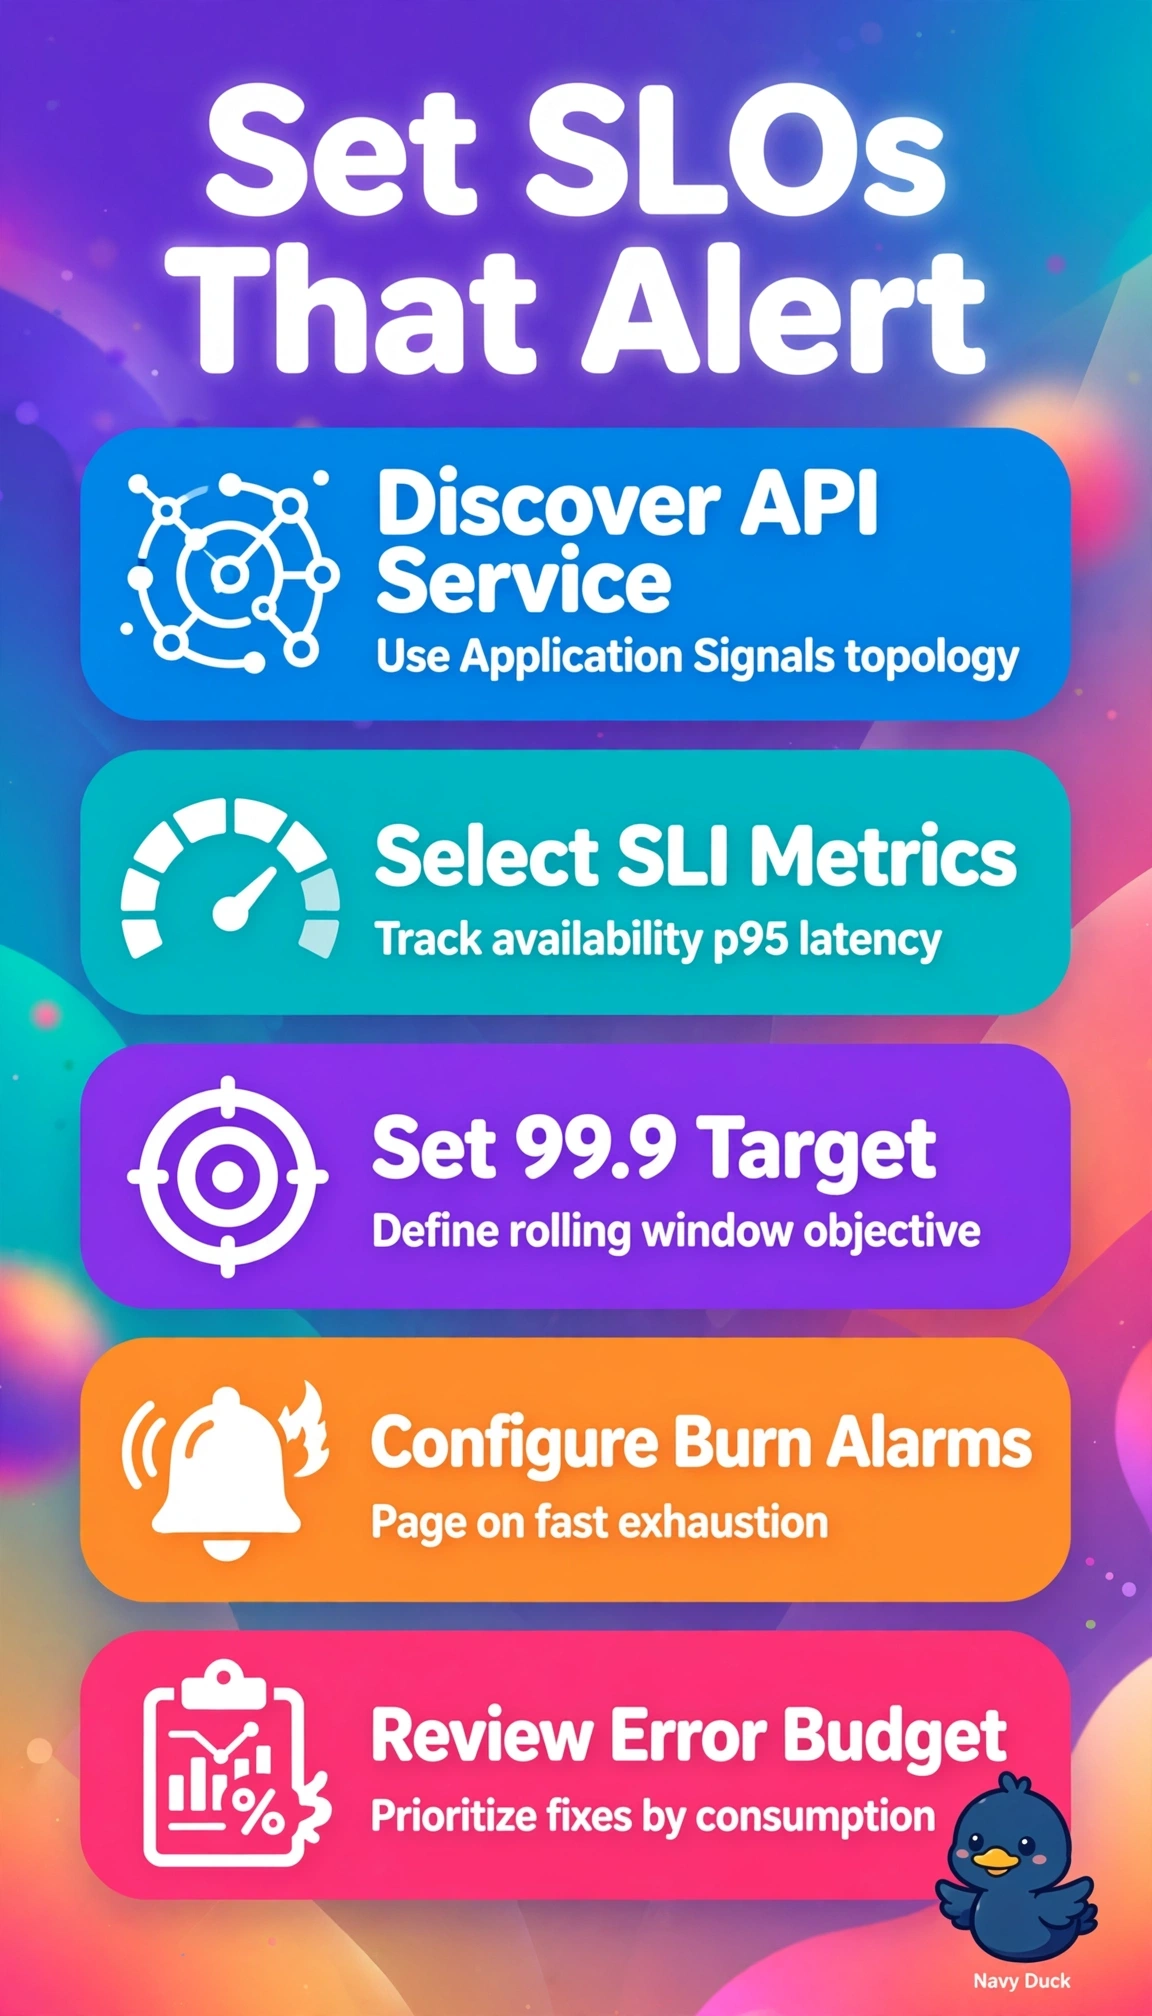
Correct design works because Application Signals discovers EKS services and operations and lets teams define SLIs for availability as successful requests over total for the 99.9% target and for p95 latency against the 300 ms target, then wraps them in SLOs with burn-rate CloudWatch alarms that track error-budget consumption over short and long windows to page before exhaustion. The static-threshold design fails on alerting concept because fixed thresholds fire on point-in-time spikes or remain quiet during slow steady burns without measuring budget pace, so it creates noise or misses exhaustion unlike burn-rate logic that scales urgency to remaining budget. The throughput-based design fails on indicator concept because throughput tracks load volume rather than user experience, so even with proper burn-rate alarms it leaves the p95 latency objective unmeasured and the SLO incomplete for the stated requirements. The Container Insights design fails on source concept because CPU, memory and pod health metrics describe infrastructure rather than Application Signals service-level SLIs, so it cannot produce standardized latency and availability SLOs with linked budget alarms. For exams, treat paging before exhaustion as a cue that burn-rate is mandatory and any static alarm or infra-only monitor is insufficient for SLO wording. Practically, verify each SLO shows SLI charts, targets, remaining budget and alarm history with a tested paging action.