
A fintech runs a SageMaker fraud model plus Bedrock agents for support, needing alerts on inference latency spikes, prediction accuracy drop, and agent tool failures. MLOps wants unified dashboards. Which observability design for AI workload metrics including drift and agent performance provides complete detection?
Select an answer to reveal the explanation.
Short Explanation
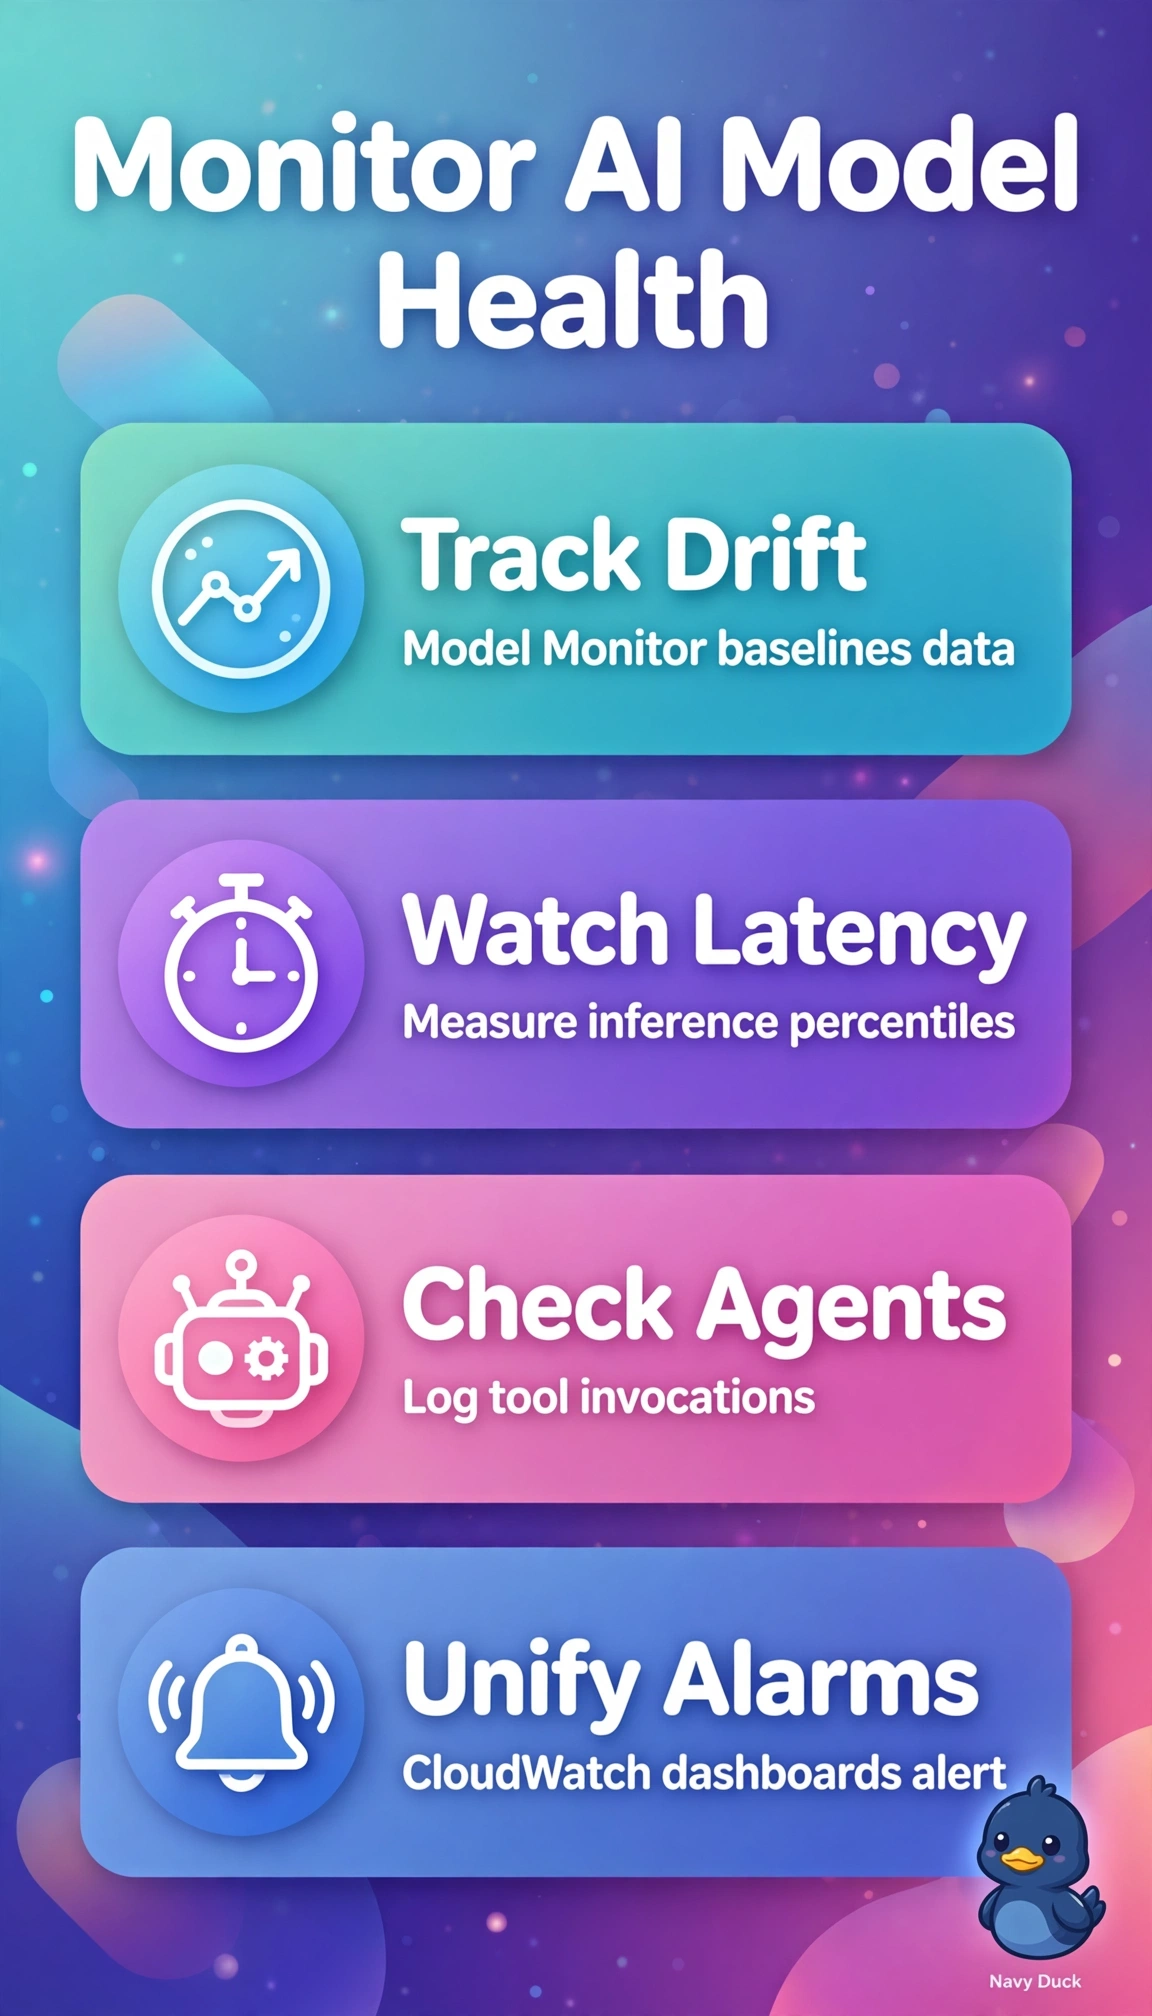
You can bring fraud-model drift and latency together with Bedrock agent failures in CloudWatch. Unified alarms and dashboards give you complete observability across both workloads.
Full Explanation
The design that combines SageMaker Model Monitor drift and latency metrics with Bedrock agent invocation metrics in CloudWatch provides the required coverage: Model Monitor compares live inference data with baselines to detect drift and prediction-accuracy drops, endpoint latency metrics alert on spikes, and agent invocation metrics reveal tool failures and orchestration errors. Unified alarms and dashboards support joint detection across fraud and support workloads. Collecting only Model Monitor drift and endpoint latency is standard for SageMaker, but it leaves Bedrock tool failures invisible. Collecting SageMaker invocation latency with Bedrock agent invocation traces supports real-time health monitoring, but latency and success telemetry cannot reveal statistical drift or gradual accuracy decay; baseline comparison through Model Monitor is needed. Collecting Model Monitor drift with Bedrock agent invocation error metrics covers model quality and agent reliability, but omits latency distribution monitoring, so p99 inference spikes and SLO breaches may go undetected. An exam caveat: distinguish invocation telemetry from model-quality monitoring, because latency and agent coverage can mask a missing drift requirement. As a practical check, verify Model Monitor baselines and schedules, plus CloudWatch alarms for p99 latency, drift violations, and agent error rate, all feeding the same dashboard.