
A microservices platform on EKS and Lambda suffers slow checkout traces spanning queues and APIs. Engineers need correlated metrics, logs, and traces with consistent context across services using open standards and minimal code changes without vendor lock-in. Which observability design provides standardized instrumentation and end-to-end visibility?
Select an answer to reveal the explanation.
Short Explanation
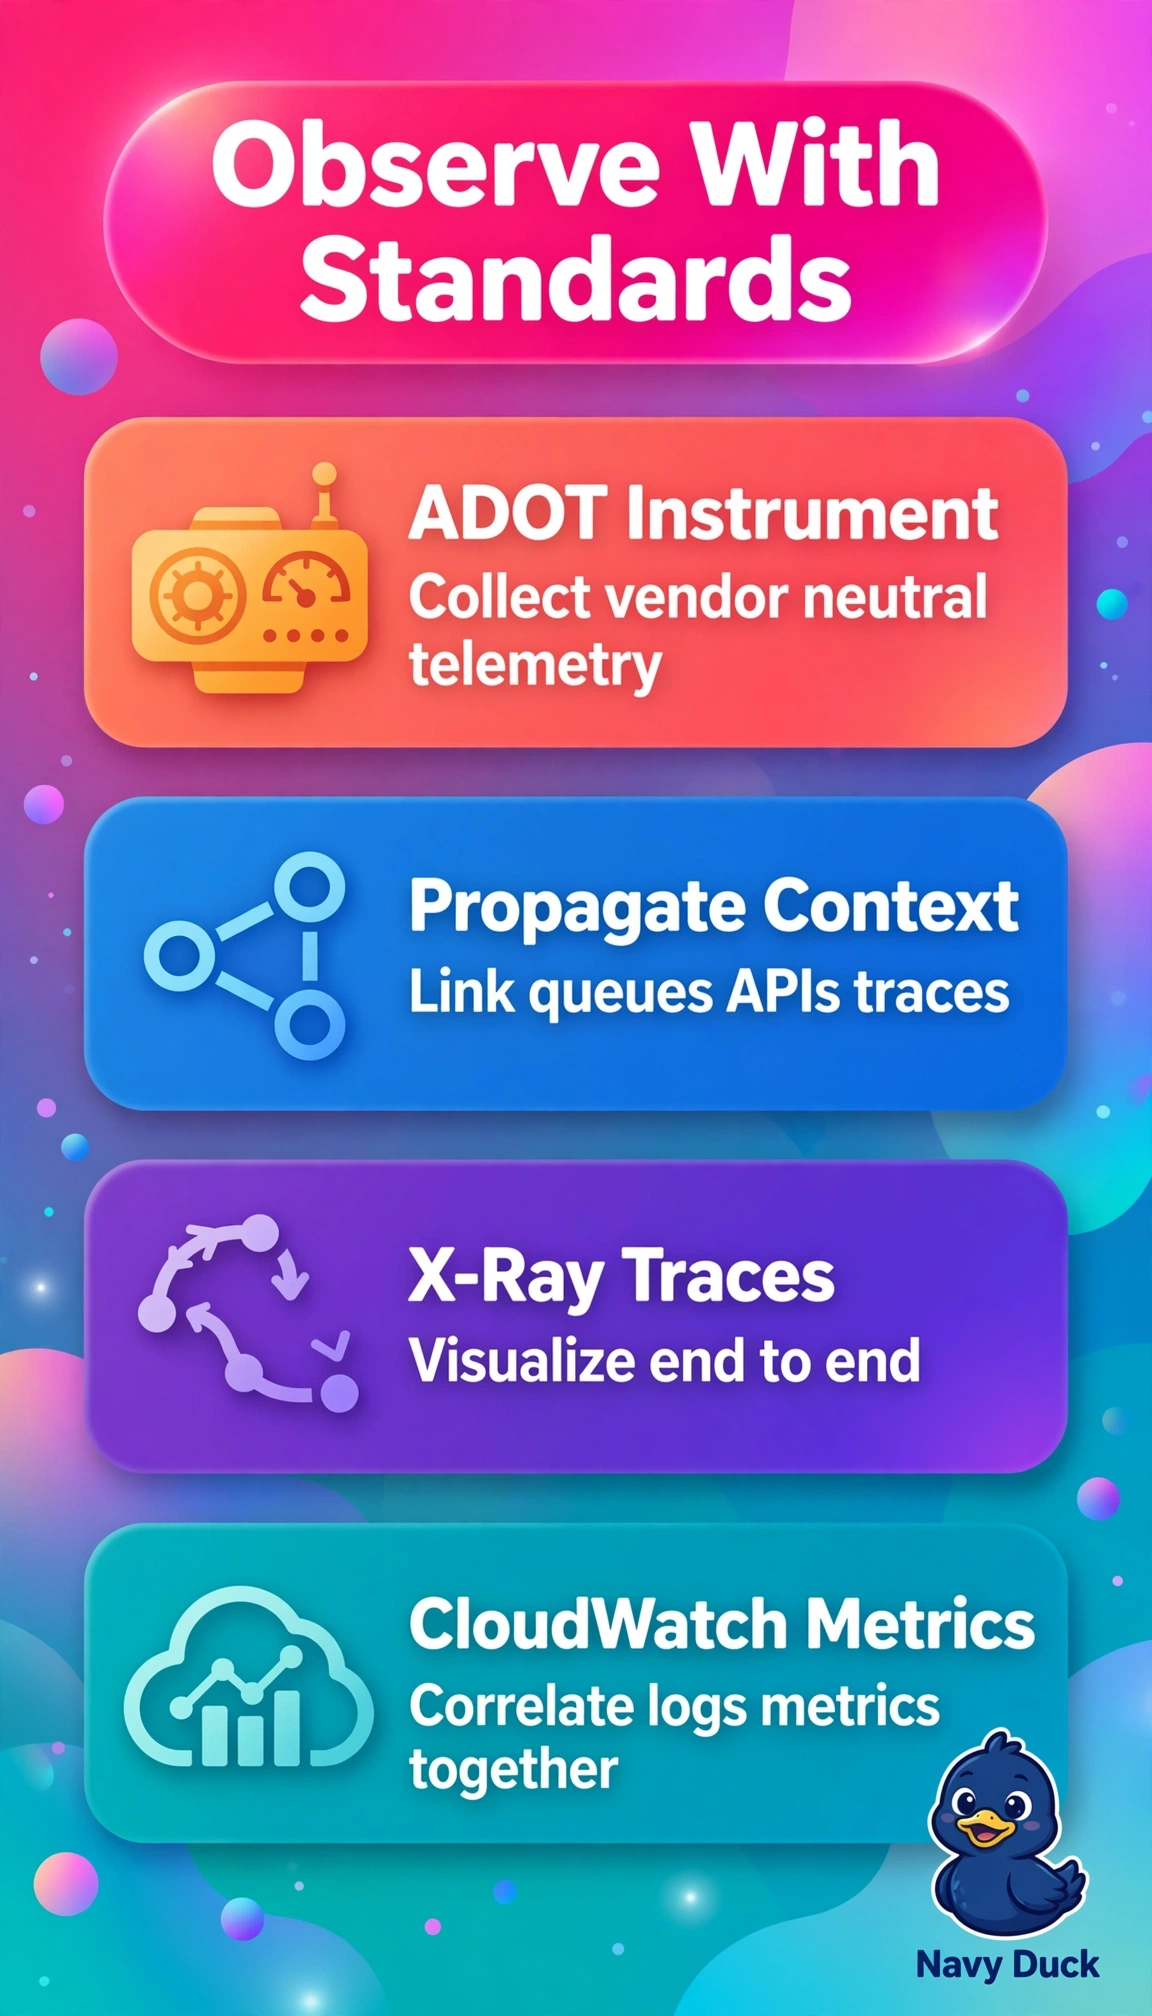
Chasing slow checkouts across services feels like untangling headphones. OpenTelemetry tags every hop with one trace ID while standardized instrumentation feeds X-Ray and CloudWatch together. You'll see the full journey in a single view.
Full Explanation
The correct design is right because AWS Distro for OpenTelemetry provides vendor-neutral OpenTelemetry APIs with auto-instrumentation for common runtimes, propagating W3C Trace Context across EKS services, Lambda functions, queues and APIs, so one checkout trace ID links correlated spans, metrics and logs with minimal code changes while exporting to managed X-Ray and CloudWatch without locking instrumentation to a vendor. The X-Ray SDK with daemon design fails by standardization because it relies on AWS-proprietary APIs and agents, which works for tracing but creates vendor lock-in and higher migration cost and violates the open-standards requirement. The split-telemetry design fails by correlation because keeping CloudWatch logs isolated per service without shared trace context prevents joining queue delay to downstream API errors, forcing manual pivoting instead of consistent context across signals. The EKS sidecar collector design fails by coverage because Lambda has no sidecar model and needs its own OpenTelemetry layer, so serverless checkout steps would appear as gaps and break end-to-end visibility across the hybrid platform. For exam caveat, distinguish instrumentation standard from backend destination: sending OpenTelemetry data to X-Ray and CloudWatch is not lock-in when Otel APIs are used, whereas proprietary SDKs are. As practical check, verify in the X-Ray trace map that a single trace ID from API through queue to Lambda shows linked spans, metrics and logs before accepting the solution.