
A retail platform runs checkout microservices on Amazon ECS Fargate and recommendations on Amazon EKS across three clusters. SREs need per-service CPU, memory, and restart signals with correlated logs without deploying sidecars, and must spot noisy-neighbor issues quickly. Which container observability configuration delivers unified performance and log correlation?
Select an answer to reveal the explanation.
Short Explanation
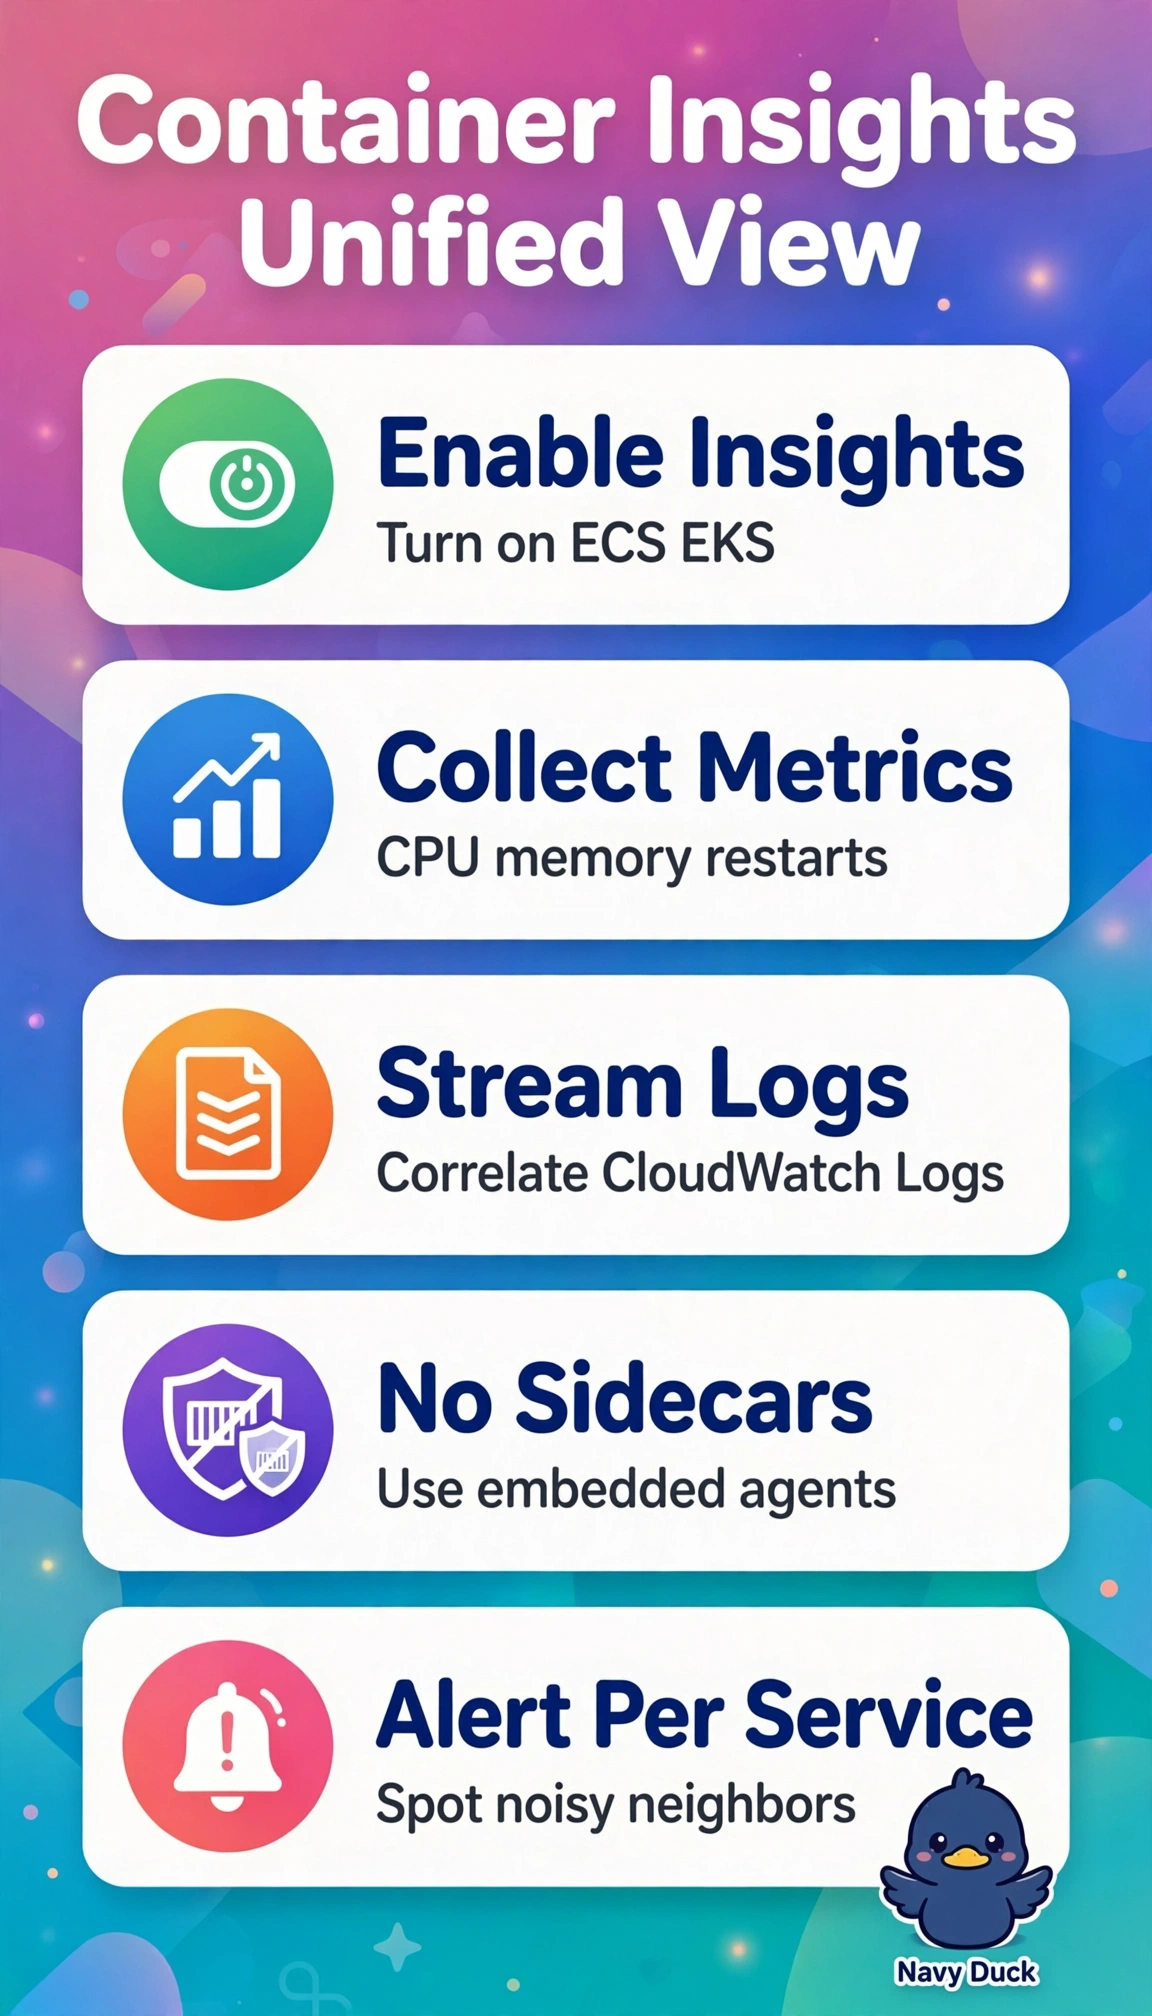
Your services are chatting, you just need one dashboard to eavesdrop properly. Container Insights gives you unified metrics plus logs without extra agents to babysit.
Full Explanation
The correct approach works because Container Insights is purpose-built to collect CPU, memory, network, and restart metrics from ECS and EKS and link them with CloudWatch Logs, giving per-service and per-pod visibility without custom sidecars. CloudTrail data event logging fails by concept because CloudTrail records API activity for auditing, not high-resolution container resource metrics or log correlation for performance troubleshooting. AWS X-Ray daemonsets fail by concept because X-Ray provides distributed tracing for request latency, not native container infrastructure metrics like CPU, memory, or restart counts. VPC Flow Logs with Athena fails by concept because flow logs capture network IP traffic metadata, which cannot reveal container CPU, memory pressure, or application logs needed for noisy-neighbor diagnosis. Exam caveat: distinguish observability services by telemetry type: metrics and logs versus traces versus audit events. Practical check: verify Container Insights namespaces appear in CloudWatch and drill from a high-CPU alarm directly into the correlated log stream.